

.jpg?width=726&height=481&name=iStock-948454524-Sevenoaks%20(2).jpg "Sevenoaks: #1 for salary growth")
Which UK towns and cities saw the biggest pay rises?
The towns and cities with the highest growth in earnings for full-time employees in the last year are:
- Sevenoaks (18.2% increase to £41,239)
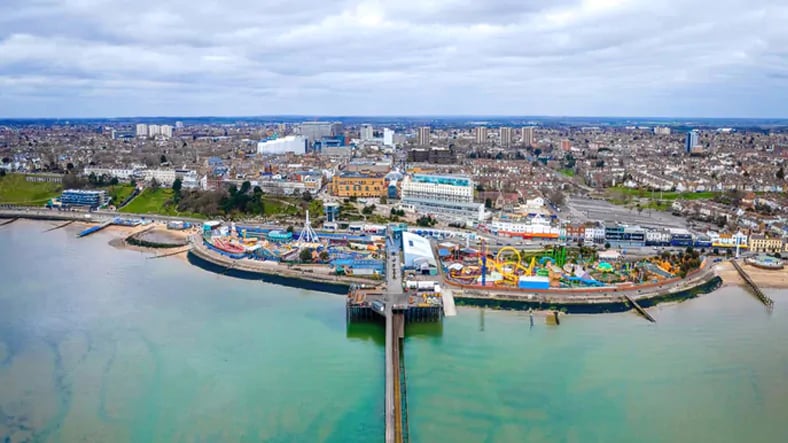
- Southend-on-Sea (17.3% increase to £39,260)
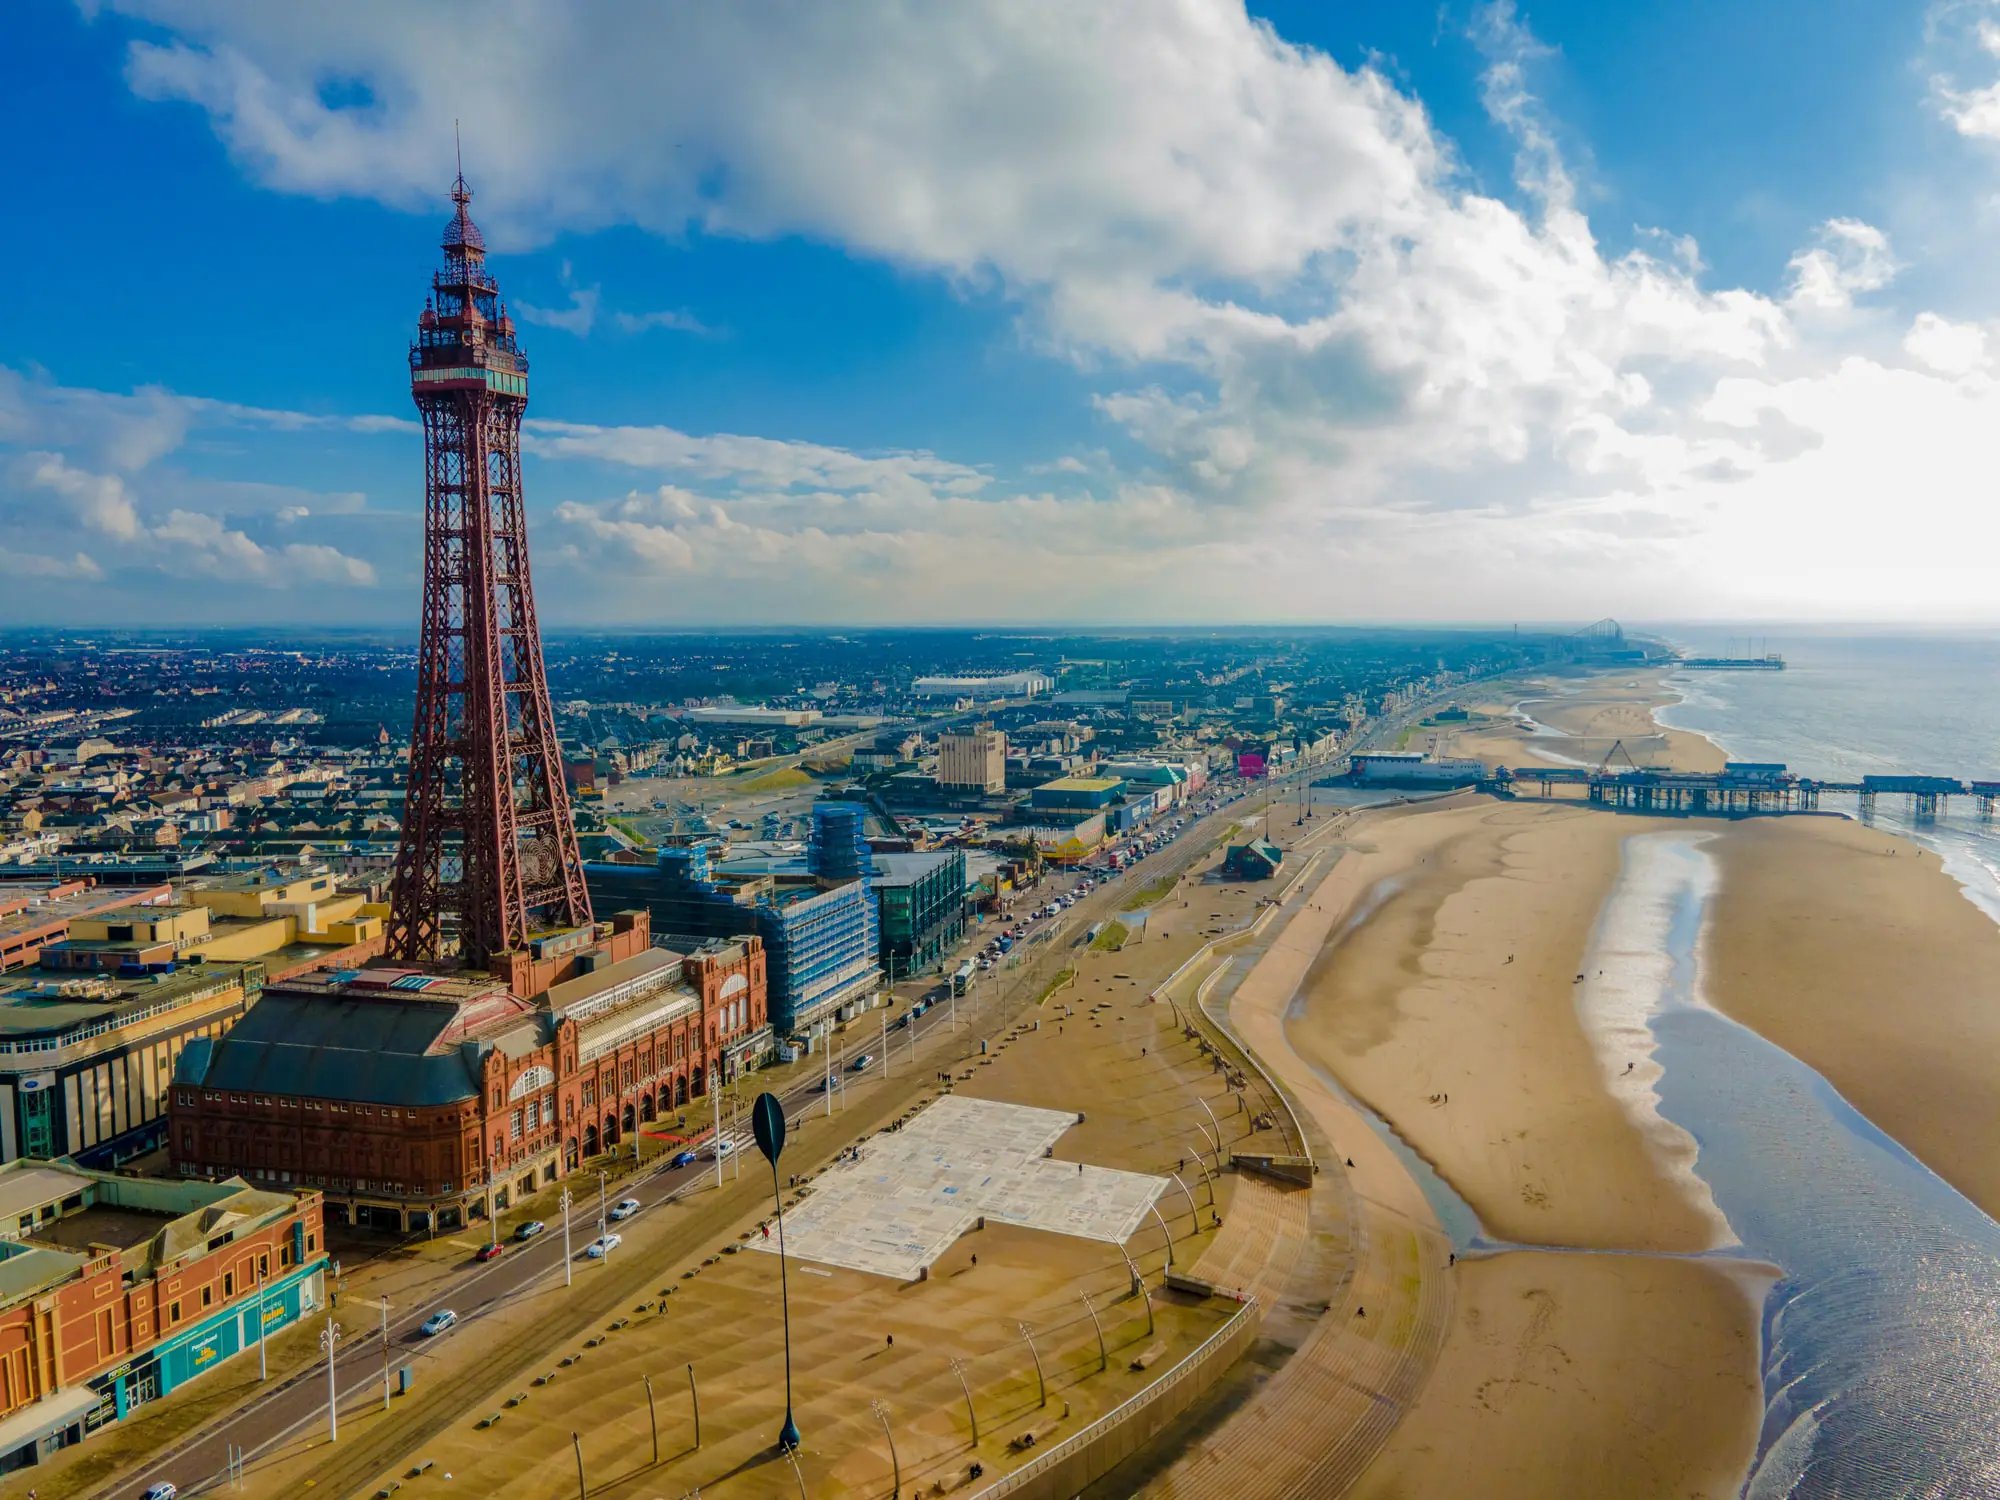
- Plymouth (16% increase to £31,615)
- Blackburn (14.8% increase to £31,527)
- Preston (14.8% increase to £33,188)
- Winchester (14.8% increase to £40,600)
Other places that saw inflation-busting pay rises (of 10% or more) include Ipswich, Warwick, Rochdale, Bolton, and Manchester.

The towns and cities with the lowest growth in earnings for full-time employees in the last year are:
- Guildford (-6.1% decrease to £40,142)
- Cheltenham (-5.5% decrease to £35,973)
- Maidstone (-4.1% decrease to £33,369)
- York (-2.1% decrease to £32,251)
- St. Helens (-1.6% decrease to £32,386)
Guildford's full-time average wage may have fallen since 2022 but at £40,142 per year, it is still 15% higher than the UK's average (of £34,963).
Towns and cities with the best-paying full-time jobs
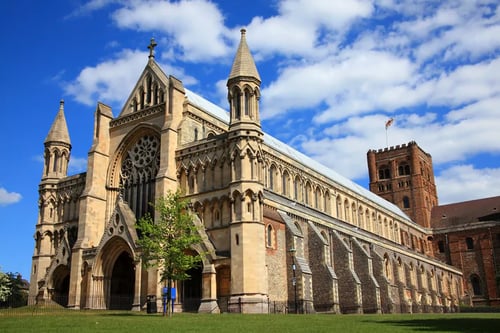
St Albans is among one of the least affordable cities to live in the UK but it does have the highest average salary for full-time workers of £47,641 (36% above the national average of £34,963).
The next highest-paying city is London, with an average salary of £41,853, followed by Warwick and Sevenoaks.
- St Albans: £47,641 (36% above UK average)
- London: £41,853 (20% above UK average)
- Warwick: £41,242 (18% above UK average)
- Sevenoaks: £41,239 (18% above UK average)
- Cambridge: £40,914 (17% above UK average)

.jpg?width=724&height=483&name=iStock-481885488-Bath%20(2).jpg)


The best cities in UK for employment opportunities are:
- Winchester (85 out of 100)
- Chelmsford (83)
- Warrington (82)
- Guildford (81)
- Exeter (81)
- Gloucester (79)
- Cheltenham (78)
- Bath (77)
- Chester (75)
- York (72)
- St Albans (72)
- Edinburgh (72)
- Reading (72)

Business density is highest in the following UK towns and cities:
- Winchester (179.1 businesses with 10+ employees per 10,000 working age adults)
- Stratford-upon-Avon (107.3)
- Chichester (98.5)
- Sevenoaks (90.6)
- Warwick (89.0)
- Guildford (87.2)
- Horsham (85.6)
- London (84.3)
- St Albans (84.0)
- Belfast (82.1)


Revealed: the 10 most affordable towns and cities to rent or buy in the UK:
- Stockton-on-Tees
- Blackburn (with Darwen)
- Preston
- Wigan
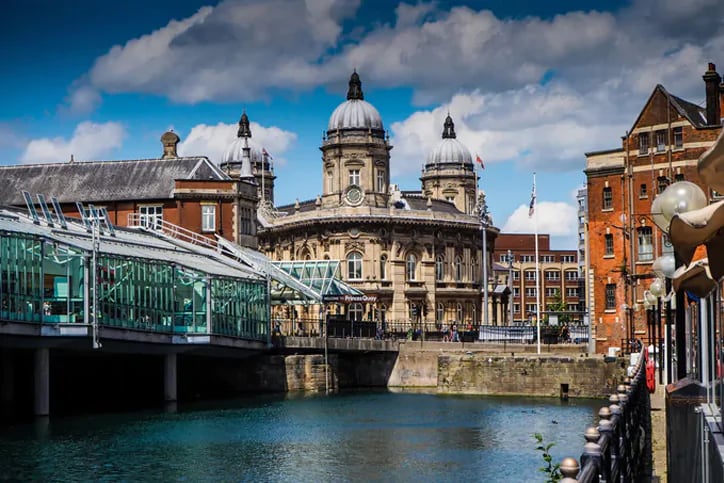
- Hull
- Doncaster
- Rotherham
- Middlesbrough
- St. Helens
- Barnsley

UK towns and cities that have the highest rent-to-salary ratio:
- London (47% of the average salary is spent on rent)
- Brighton and Hove (45%)
- Oxford (45%)
- Bristol (44%)
- Edinburgh (42%)

UK towns and cities with the highest average property prices* (comparative to the average salary):
- Guildford: £840,608 (20.9x average salary)
- Sevenoaks: £740,031 (17.9x average salary)
- London: £689,410 (16.5x average salary)
- Winchester: £665,891 (16.4x average salary)
- Bath: £594,503 (15.6x average salary)


The UK towns and cities where residents reported the highest life satisfaction scores are:
- St Albans: 7.97 out of 10
- Maidstone: 7.92 out of 10
- Oxford: 7.8 out of 10
- Colchester: 7.78 out of 10
- Sevenoaks: 7.73 out of 10
- Winchester: 7.72 out of 10
- Edinburgh: 7.69 out of 10
- Stratford-on-Avon: 7.68 out of 10
- Lancaster: 7.63 out of 10
- Ipswich: 7.62 out of 10
'The happiest towns and cities to live in the UK' – top 10 places with the highest happiness scores:
- Sevenoaks: 7.89 out of 10
- Chelmsford: 7.79 out of 10
- Preston: 7.79 out of 10
- Lancaster: 7.78 out of 10
- Havant: 7.77 out of 10
- Cheltenham: 7.73 out of 10
- Bridgend: 7.72 out of 10
- Plymouth: 7.71 out of 10
- Bracknell: 7.67 out of 10
- Luton: 7.64 out of 10