The latest employee earning figures from the Office for National Statistics reveal that many popular job roles in the UK have gender pay gaps.
HR and payroll software provider Ciphr analysed the official data to find out which occupations, industries, and places in the UK have the widest and smallest gender pay gaps in 2024.
Key findings:
- Over three-quarters (76%) of all occupations / job roles in the UK have gender pay gaps in favour of men
- Most (85%) occupations that employ 50,000 full-time workers or more in the UK have gender pay gaps in favour of men
- Two-thirds (66%) of female-dominated occupations – where 60% or more of the jobs (full- and part-time) are filled by women – have gender pay gaps in favour of men
- Almost all (89%) industries in the UK have gender pay gaps in favour of men
Quick links:


Popular jobs in the UK and their gender pay gaps
Based on Ciphr's analysis, most (85%) occupations that employ 50,000 full-time workers or more in the UK have gender pay gaps in favour of men. Only 3% of such job roles have no reported pay gaps, and around one in eight (12%) pay women more.
Occupations with the largest workforces appear the most likely to have a gender pay gap. According to the latest data, 95% of jobs with over 200,000 full-time employees in the UK have a gender pay gap in favour of men. This includes popular roles such as IT manager, registered nurse, admin assistant, LGV driver, secondary school teacher, retail assistant, payroll manager, warehouse operative, marketing director, and financial manager.
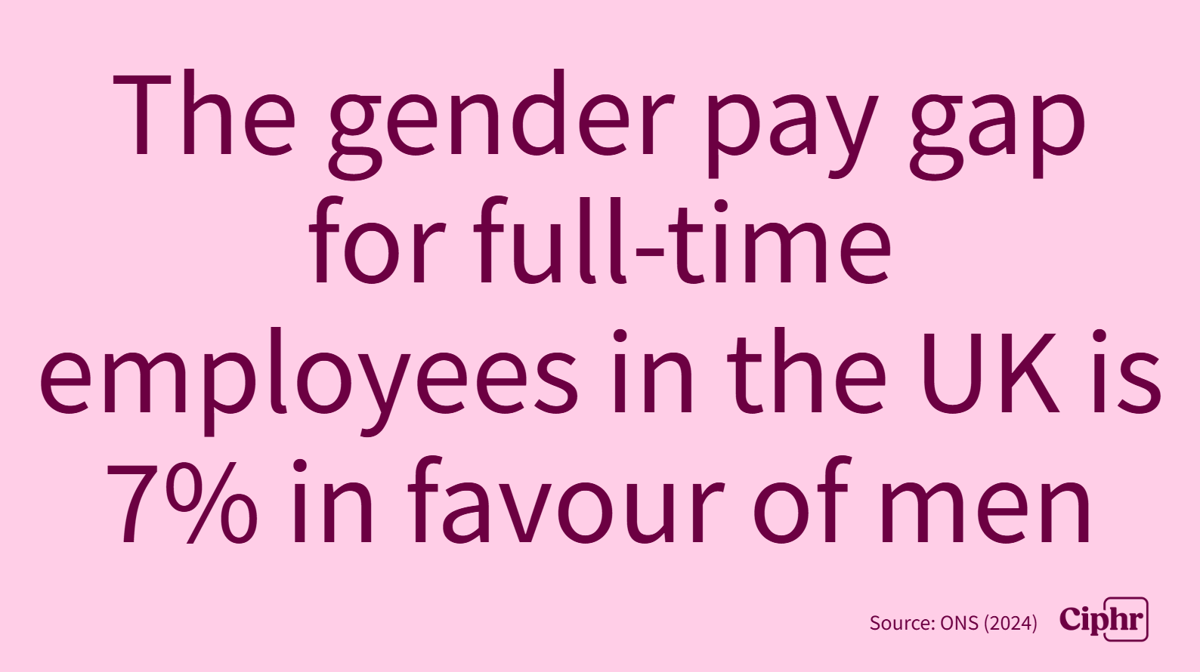
Across all occupations, the average median gender pay gap for full-time workers in the UK in 2024 is 7% in favour of men. This means that the gender pay gap has decreased slightly (by 0.5%) for full-time workers over the last year (it was 7.5% in 2023). But women’s hourly pay still lags behind men’s hourly pay in many occupations.
The UK’s mean gender pay gap for full-time employees is 11.3% in favour of men.
Women working full-time in the private sector must also contend with a bigger pay gap than those in the public sector (12.5% vs 10%).
For all workers (full- and part-time), the UK’s median gender pay gap in 2024 is 13.1% in favour of men (down 1.1% from 14.2% in 2023). So, women in the UK only earn 87 pence, on average, for every pound men earn.
Popular full-time jobs and their gender pay gaps in 2024
Ciphr's research found that:
- Over 15.5 million people in the UK hold full-time job roles that have a gender pay gap of 1% or higher in favour of men. And about 1.9 million are in occupations that have a gender pay gap of 1% or higher in favour of women
- The three occupations employing the largest number of full-time workers (over 1.3 million people in the year to June 2024) are programmers and software development professionals, care workers and home carers, and secondary education teaching professionals
- The average gender pay gap for programmers and software development professionals – an umbrella term that includes over 120 job titles, such as software engineer, machine learning engineer, app developer, games designer, computer programmer, IT analyst and software architect – is 17% in favour of men (up from 10% in 2023). 83% of people employed full-time in this role are men
- Women employed as full-time care workers in the UK do have gender pay parity (75% of the workforce are women). The gender pay gap for this job role is actually tipped in favour of women at -0.6%
- The gender pay gap for full-time secondary school teachers (53% of which are women) has reduced to 1.9% (from 4.6%) in favour of men
- There are 367,900 full-time administrative / clerical workers in the UK – about 70% of which are women. Other administrative occupations n.e.c. (which includes job titles like administrative assistant, clerical assistant and office administrator) has a gender pay gap of 4.6% in favour of men. So, women doing this job typically only earn an average of 95p for every pound earned by men
- The fifth largest full-time occupation in the UK is financial managers and directors, with around 308,000 workers (37% of which are women) and a 23.8% gender pay gap in favour of men
The most common job roles in the UK and their gender pay gaps for 2024
Which job has the widest gender pay gap in 2024?
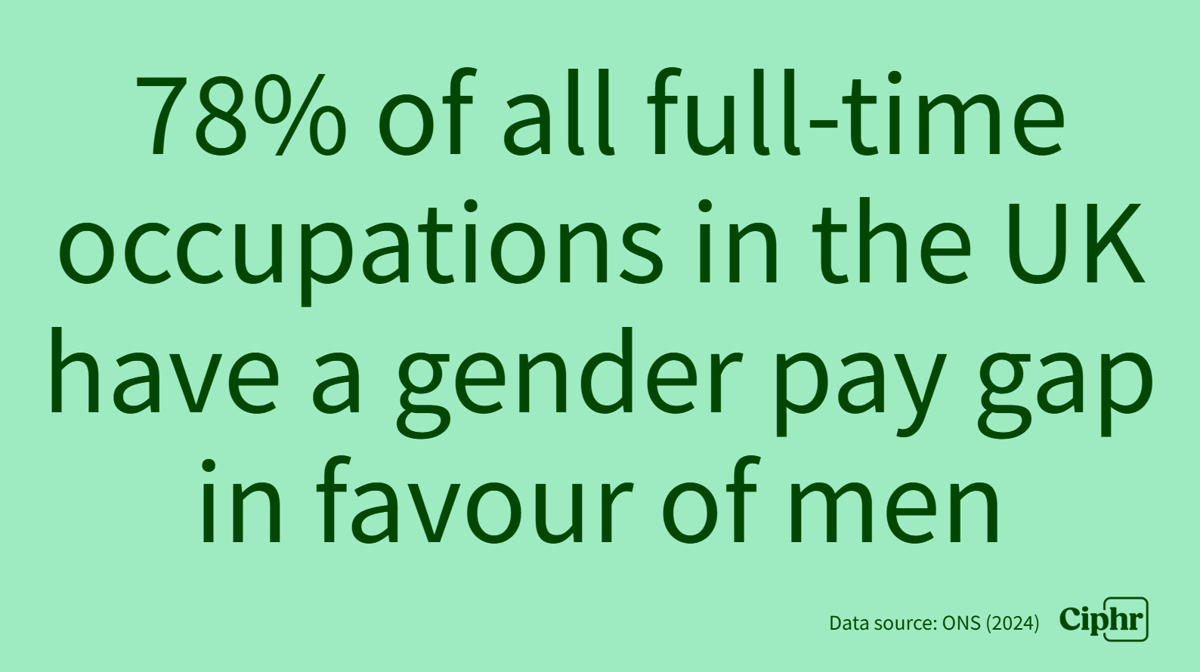
Around eight out of 10 (78%) full-time occupations in the UK have gender pay gaps in favour of men. The full-time job with the widest gender pay gap, at 29.5%, is electrical and electronics technicians. Most (94%) of the 27,200 people working in this role are men. Next comes cybersecurity professionals, with a significant gender pay gap of 28.2%.
Which jobs have gender pay parity?
There are only five full-time occupation types with no reported gender pay gaps for 2024:
- National government administrative occupations (employing 170,700 people)
- Data analysts (108,800)
- Kitchen and catering assistants (101,200)
- Senior care workers (82,900)
- Leisure and travel service occupations n.e.c. (8,700 people, including tour guides, holiday rep, tourist information officer, and ship steward)
Some of the occupations with the narrowest gender pay gaps (closest to zero) include social workers, care workers and home carers, customer service occupations n.e.c., other nursing professionals, restaurant and catering establishment managers and proprietors, and primary education teaching professionals.
Has the UK's gender pay gap decreased in 2024?
While the UK's gender pay gap for full-time employees has narrowed slightly over the past year (down by 0.5% to 7% in 2024), there's still a very long way to go to close it. (Progress is slow: the gender pay gap was also down to 7% in 2020.)
Generally, though, more full-time jobs have decreased their gender pay gaps in favour of men than increased them in the past year. Over half (57%) of occupations that had a gender pay gap in favour of men in 2023 have a lower gender pay gap in 2024 (compared to 42%, which have higher gender pay gaps in favour of men now).
Note:
The ONS's 2024 UK gender pay gap data includes 412 jobs in total (however, estimates are unavailable or considered unreliable for 66 of these occupations). The remaining 346 jobs, with reliable / available estimates, employ over 27.2 million people. Of these 346 jobs: 76% (or 262) have a median gender pay gap in favour of men, 22% (or 78) have a gender pay gap in favour of women, and 1.7% (or 6) have no gender pay gap.
Looking just at the median gender pay gap data for full-time employees (omitting 82 jobs with missing or unreliable estimates): 78% (or 257) have a gender pay gap in favour of men, 21% (or 68) have a gender pay gap in favour of women, and 1.5% (or 5) have no gender pay gap.
For part-time employees (omitting 212 jobs with missing or unreliable estimates): 46% (or 91) have a gender pay gap in favour of men, 52% (or 104) have a gender pay gap in favour of women, and 2.5% (or 5) have no gender pay gap.
(Totals may not sum due to rounding.)
Female-dominated jobs with the widest gender pay gaps
Ciphr reviewed the 2024 gender pay gap data to see whether occupations that have more female employees than male employees also have widespread gender pay gaps.
Two-thirds (66%) of all female-dominated occupations (where 60% or more of the jobs are filled / held by women working full- or part-time) have gender pay gaps in favour of men. Only 3% of these jobs have no reported pay gaps, while less than a third (31%) have gender pay gaps in favour of women.
Female-dominated occupations with the widest gender pay gaps in 2024
All job roles shown have workforces of 50,000 or more full- and part-time employees.Workers in full-time employment
Nearly two-thirds (63%) of UK job roles held by a greater number of full-time female employees than full-time male employees have a gender pay gap in favour of men.
- The female-dominated occupation with the largest gender pay gap for full-time employees, at 16%, is health associate professionals n.e.c. (including health trainer, antenatal teacher, diet adviser, home economist, and therapist). Women doing this job in the UK typically only earn an average of 84p for every pound a man earns
- Other female-dominated roles with high gender pay gaps include: other educational professionals n.e.c (including bursars, university administrators, moderators, academic tutors, and learning support officers), residential, day and domiciliary care managers and proprietors; and health care practice managers. The gender pay gaps for these roles are 15.8%, 14.1% and 13.8% respectively
- The female-dominated occupation with the fifth-largest gender pay gap (12.4% in favour of men) is mental health nurses. Women doing this job typically only earn an average of 88p for every pound earned by a man
- Other job roles with high gender pay gaps, despite having large female workforces, include clinical psychologists, librarians, office managers, early education and childcare practitioners, and welfare professionals n.e.c. All these female-dominated occupations pay men at least 10% or more per hour than women, on average
Female-dominated occupations with the largest (and smallest) gender pay gaps for full-time employees
Which male-dominated jobs pay women more than men?
One in eight (12%) male-dominated occupations (where 60% or more of the full-time jobs are filled / held by men) have gender pay gaps in favour of women.
Some of the male-dominated jobs that pay full-time women more than full-time men include parking and civil enforcement occupations (-11.7%), shelf fillers (-11.4%), leisure and theme park attendants (-10.9%), IT trainers (-10.8%), train and tram drivers (-10.7%), security guards and related occupations (-6.8%), and gardeners and landscape gardeners (-6.2%).
Gender-balanced roles and their gender pay gaps
Gender pay gaps also persist for many full-time occupations that employ a relatively equal number of male and female employees.
Ciphr researchers compared gender pay gap data for job roles where at least 45% (and no more than 55%) of the workforce are women, and at least 45% (and no more than 55%) of the workforce are men. They found that nearly two-thirds (64%) of these 'gender-balanced' job roles have gender pay gaps of 1% or higher in favour of men, while nearly a fifth (19%) have gender pay gaps of 1% or higher in favour of women.
- The gender-balanced, full-time job with the largest gender pay gap in favour of men (20%) is public relations and communications directors. Women holding this job earn 80p, on average, for every £1 that men earn
- This is followed by managers and proprietors in other services n.e.c. (roles in this occupational group include recruitment agency manager, driving school manager, library manager and customer experience manager) which has a gender pay gap of 14.3%
- Some of the other gender-balanced job roles with gender pay gaps above 5% include paramedics, design occupations n.e.c. (such as make-up artists, games designers, and stylists), and pensions and insurance clerks and assistants (13.2%, 11.9%, and 6.2% respectively)
- There are 142,600 people (50% men and 50% women) working full-time as chartered and certified accountants in the UK. It has a 3.5% gender pay gap in favour of men
- The occupations with some of the narrowest gender pay gaps (closest to zero) are further education teaching professionals, and launderers, dry cleaners and pressers. They have a gender pay gap of 0.5% in favour of men and -0.3% in favour of women respectively
- National government administrative occupations (which includes a range of administrative jobs in the government, armed forces, at the Office for National Statistics (ONS), HM Land Registry, courts of justice, Jobcentre Plus, Meteorological Office, and Health and Safety Executive) have no reported gender pay gap for 2024
'Gender-balanced' job roles and their gender pay gaps for 2024
Which parts of the UK have the largest gender pay gaps?
-
 Cambridge
 -
 Reading
 -
 Warwick
To find out which places have the largest and smallest gender pay gaps for full-time employees, Ciphr compared ONS data for the 100 biggest cities and towns in the UK. The gender pay gap figures quoted here are based on where organisations/employers are located, rather than where their employees live.
Bracknell, Cambridge, and Basildon topped the list with the widest gender pay gaps in favour of male full-time workers.
Organisations based in these three local authorities have gender pay gaps of 25.6%, 22.1%, and 20.9% respectively.
Other towns and cities with gender pay gaps of 18% or more include Reading (gender pay gap of 20.3%), St Albans (19.5%), Stockport (18.8%), Guildford (18.1%), and Warwick (18.1%).
Derby and Chichester are also in the top ten, with gender pay gaps of just under 18%. This means that women employed by firms based in these two cities earn around 82p for every £1 men earn.
In comparison, Welsh and Scottish towns and cities tend to have lower gender pay gaps for full-time workers, with the widest in Edinburgh (9.9%), Glasgow (6.3%), Aberdeen (5.3%), Dundee (4.6%), Bridgend (2.8%), Caerphilly (1.9%), and Cardiff (1.1%). (Comparable data for Northern Ireland was not available.)
UK towns and cities with the lowest (under 1%) gender pay gaps in favour of men include Gateshead (0.1%), Sunderland (0.1%), Barnsley (0.2%) and Blackpool (0.5%).
Southend-on-Sea has the lowest (-0.7%) gender pay gap in favour of women, while Wrexham in Wales has the highest at -12.1%.
The infographics below show the top 15 major towns and cities with the biggest gender pay gaps in favour of men, plus the nine towns and cities with gender pay gaps in favour of women in 2024. Keep scrolling for a map illustrating the gender pay gaps across the UK.
Towns and cities with the widest gender pay gaps in favour of men in 2024
Towns and cities with the widest gender pay gaps in favour of women in 2024
Which local authorities have the largest gender pay gaps?
Mole Valley in Surrey has the widest gender pay gap in the UK in 2024 at 31.9%. This means that full-time female employees working at organisations based in Mole Valley earn 68p, on average, for every pound that men earn.
Gravesham, Woking, and Tower Hamlets also have gender pay gaps of 28% or over in favour of men.
The local authorities with the largest gender pay gaps in favour of women in 2024 include North Ayrshire (gender pay gap of -26.4%), Adur (-26.1%), and Ceredigion (-24.7%). This means that full-time male employees working at organisations based in these areas earn 74-75p, on average, for every pound that women earn.
Where are the biggest gender pay gaps in the UK?
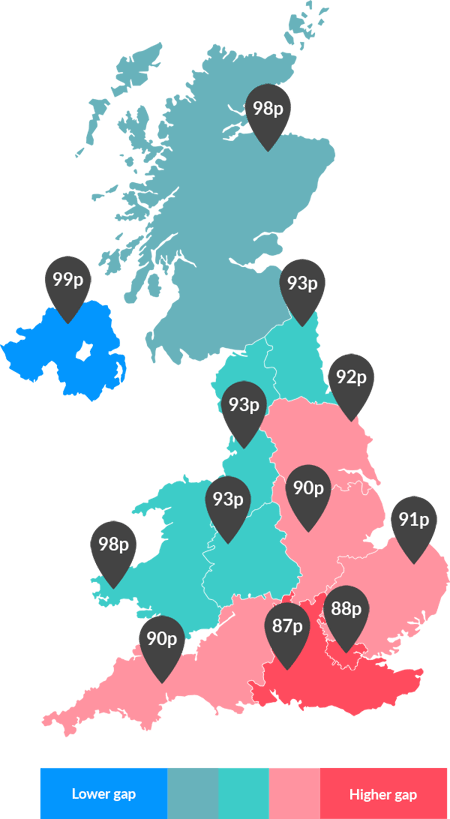
England leads the four nations when it comes to the widest gender pay gaps in favour of men. Without exception, all English regions have higher gender pay gaps than Wales, Scotland and Northern Ireland. The gender pay gap for full-time workers has decreased, however, in six of nine regions in England (and stayed at the same level in two regions).
The South East, London, and East Midlands top the list of places with the widest gender pay gaps in favour of men in 2024. Organisations based in these areas have gender pay gaps of 13.3%, 12.4%, and 10.1% respectively.
Northern Ireland is the closest to closing its gender pay gap, at 0.8%.
Northern Ireland has the lowest gender pay gap for full-time workers at 0.8%, with Wales at 1.9%, Scotland at 2.2%, and England at 8.3%.

The geographical data shown above is for full-time employees and by place of work (not by place of residence).
Which job roles have the widest gender pay gaps?
Looking at the data by pay disparity rather than employee numbers, there are many occupations – spanning numerous sectors – with far wider gender pay gaps for full-time workers than the UK average of 7%.
The top three occupations in the UK with the widest gender pay gaps in favour of men include electrical and electronics technicians (29.5%), cyber security professionals (28.2%) and rail construction and maintenance operatives (28.1%).
Top 25 job roles that pay men more than women (2024)
Jobs with the widest gender pay gaps in favour of women
The five full-time jobs with the widest gender pay gaps in favour of women include other drivers and transport operatives n.e.c. (-22.2%), social and humanities scientists (-20.7%), officers of non-governmental organisations (-18.6%), psychotherapists and cognitive behaviour therapists (-18.1%), and personal assistants and other secretaries (-17.5%).
Other full-time jobs that pay women more per hour than men include teachers of English as a foreign language (-15.9% gender pay gap), veterinary nurses (-15.4%), IT trainers (-10.8%), train drivers (-10.7%), dispensing opticians (-8.2%), and beauticians (-7.3%).
Occupations with gender pay gaps in favour of women
Top 25 job roles that pay women more than men (2024)
Which industries in the UK have the largest gender pay gaps for full-time workers?
According to the latest employee earnings data from the Office for National Statistics, the median gross annual salary for people in full-time employment in the UK increased by 6.9% to £37,430 a year in 2024 (this amount includes basic pay plus incentive pay, shift-premium pay, overtime pay and other pay).
The average gross weekly pay for full-time employees is £728.30 (basic pay plus incentive pay, shift-premium pay, overtime pay and other pay) and the average hourly rate (basic pay, excluding overtime) is £18.64.
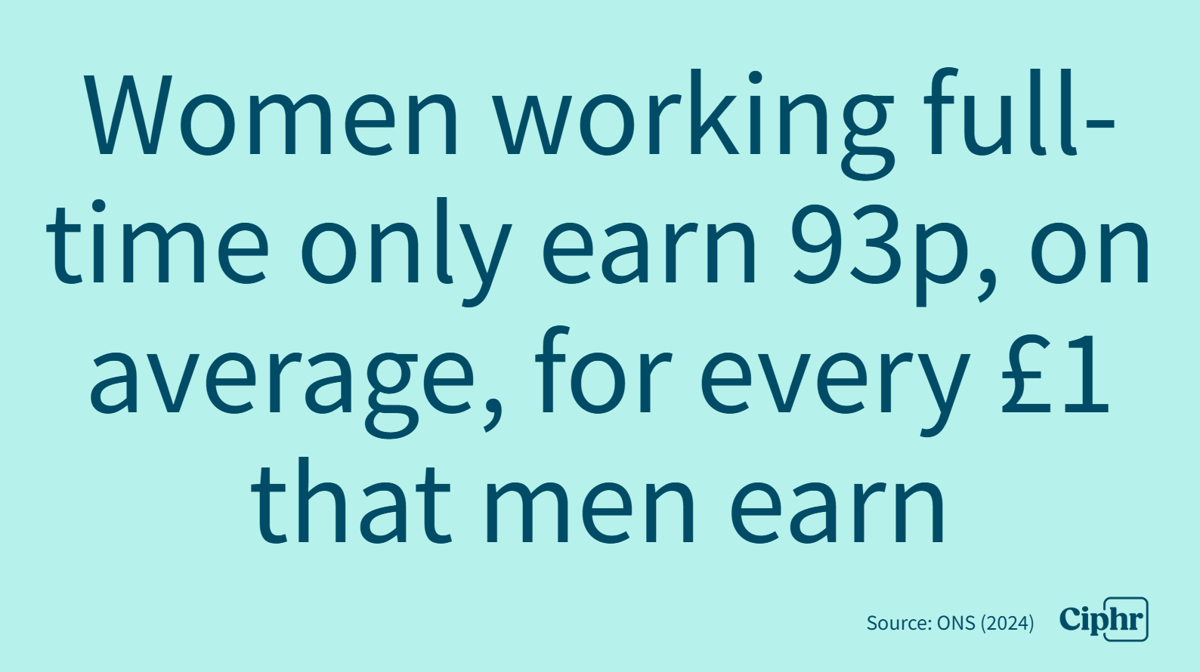
The median (basic) pay for full-time male employees is currently £19.24 an hour (excluding overtime). Full-time female employees are paid £1.36 less, on average – at £17.88 an hour. This works out to a 7% gender pay gap, which means that, on an hourly basis, women earn 93p for every pound men earn.
To see how your hourly rate compares with the UK average, try Ciphr’s hourly wage calculator.
Ciphr’s analysis of the 2024 gender pay gap data shows that, on average (where estimates are available), men’s full-time hourly pay is higher than women’s full-time hourly pay in almost (94%) every UK industry. Pay gaps vary from 1.3% for transportation and storage up to 25.2% for those employed in financial and insurance activities.
Only one industry in the UK (the water supply, sewerage, waste management and remediation activities sector) pays its full-time female employees more, on average, per hour than its full-time male employees.
Industries with the biggest gender pay gaps in favour of men
- The highest paying industry for full-time workers in 2024 is electricity, gas, steam and air conditioning supply, with an average salary of £53,161 a year. Its gender pay gap in favour of men is 9.5%
- Workers employed in financial and insurance activities were paid an average of £52,247 a year. The gender pay gap in favour of men is 25.2%
- The third highest paid sector is information and communication, with an average salary of £48,320 in 2024. The gender pay gap is 13.3%
- Full-time employees working in mining and quarrying are the next highest paid at £47,599 (gender pay gap data is unavailable/unreliable for 2024)
- The next (fifth) highest paying sector is professional, scientific and technical activities, which has a gender pay gap of 17.1% in favour of men
- The lowest earners in 2024, on average, were those working in the accommodation and food service industry (the gender pay gap in favour of men is 3.5%). Their average salary of £27,414 is around three-quarters (73%) of the UK average
UK industries and their gender pay gaps for full-time workers in 2024
Changes in the UK's gender pay gap over time
Looking at the ONS' gender pay gap data by major occupational groups rather than specific roles reveals yet more pay inequality for women in the workplace.
All nine major groups of full-time occupations, and over 8 in 10 (85%) of the 26 sub-major groups of full-time occupations in the UK (as classified by the ONS) pay men more than women. And, some have far wider pay gaps than the UK average of 7%.
That said, since 2020, two-thirds (66%) of the nine major groups of full-time occupations have reduced their gender pay gaps (shown in the chart below). Caring, leisure and other service occupations, for example, which includes jobs such as care workers, teaching assistants, dental nurses, air travel assistants, animal care workers, and barbers, has seen its gender pay gap in favour of men fall from 6.5% to 2.3%.
Women working in skilled trades occupations (as farmers, chefs, mechanics, electricians, plumbers, bakers, butchers, and catering managers), however, are the furthest from pay parity. The gender pay gap in favour of men for roles in this occupational group is still the worst in the UK at 15.7% (down from 19.7% in 2020).
Gender pay gaps for full-time employees: 2020 to 2024
Gender pay gap survey 2024
Ciphr commissioned a survey of 2,000 UK adults, including 1,188 employees, to find out how closely people’s perceptions of the gender pay gap (if any) matched the reality of the latest gender pay gap figures from the ONS.
The findings revealed that most people underestimate how many jobs in the UK have gender pay gaps in 2024.
Here’s some of the jobs that people thought were most likely to have gender pay gaps:
• Chief executives (CEOs) and senior officials: 35% of respondents
• Private sector jobs: 26%
• Financial managers and directors: 31%
• HR managers and directors: 23%
• Programmers and software development professionals: 21%
Notably, one in five (22%) UK adults don’t think there are any job roles with gender pay gaps in favour of men in 2024. And, just 8% of surveyed employees think their own jobs have gender pay gaps.
For more results and further analysis of this research, check out the table below and read Ciphr’s press release: Most people underestimate the scale of the UK’s gender pay gap
Notes
Unless otherwise indicted, all median gender pay gap data, earnings estimates, and workforce numbers are for full-time employees.
Earnings data relates to the tax year ending 5 April 2024. Earnings estimates shown are median hourly earnings (excluding overtime) and median gross earnings (weekly and annual) for full-time workers (which includes basic pay plus incentive pay, shift-premium pay, overtime pay and other pay).
Occupational roles are listed as per the ONS’s one- and four-digit Standard Occupational Classification (SOC2020) codes. Broad occupational categories, with two- or three-digit SOC codes, were not included.
All data and wage gap statistics sourced from the Office for National Statistics (ONS):
- Gender pay gap in the UK: 2024 (provisional dataset released on 29 October 2024): https://bit.ly/3YHiqsz
- Employee earnings in the UK: 2024 (Measures of employee earnings, using data from the Annual Survey for Hours and Earnings – ASHE: provisional dataset released on 29 October 2024): https://bit.ly/3YGxtTv
- NOMIS – Occupation (SOC2020) by sex, employment status and full/part-time (online dataset: July 2023-June 2024): https://bit.ly/40pJZHy
- Mid-2023 estimates of the population for the UK, England, Wales, Scotland and Northern Ireland (released 8 October 2024) – Table MYE2: Persons by single year of age and sex for local authorities in the UK, mid-2023: http://bit.ly/3WuIUdM
- SOC 2020 Volume 2: the coding index and coding rules and conventions (Version 11: 16 October 2024): https://bit.ly/47wT2Zo
- Gender pay gap in the UK: 2023 (revised dataset released in October 2024), and 2020, 2021 and 2022 (revised datasets): https://bit.ly/3YHAOBS
Fair use statement: If you are interested in sharing these statistics, or quoting this study in an article, please include a link to this infographic page and credit Ciphr. Thanks.


