In a 2021 survey, HR software provider Ciphr asked 1,031 British workers to rate the likelihood of their own occupation becoming automated.
On average, a third of women (33%) and over two-fifths (43%) of men said that it was likely or very likely that their current job role could be replaced by technology or machines (such as smart software, automation or robotics) in the future.
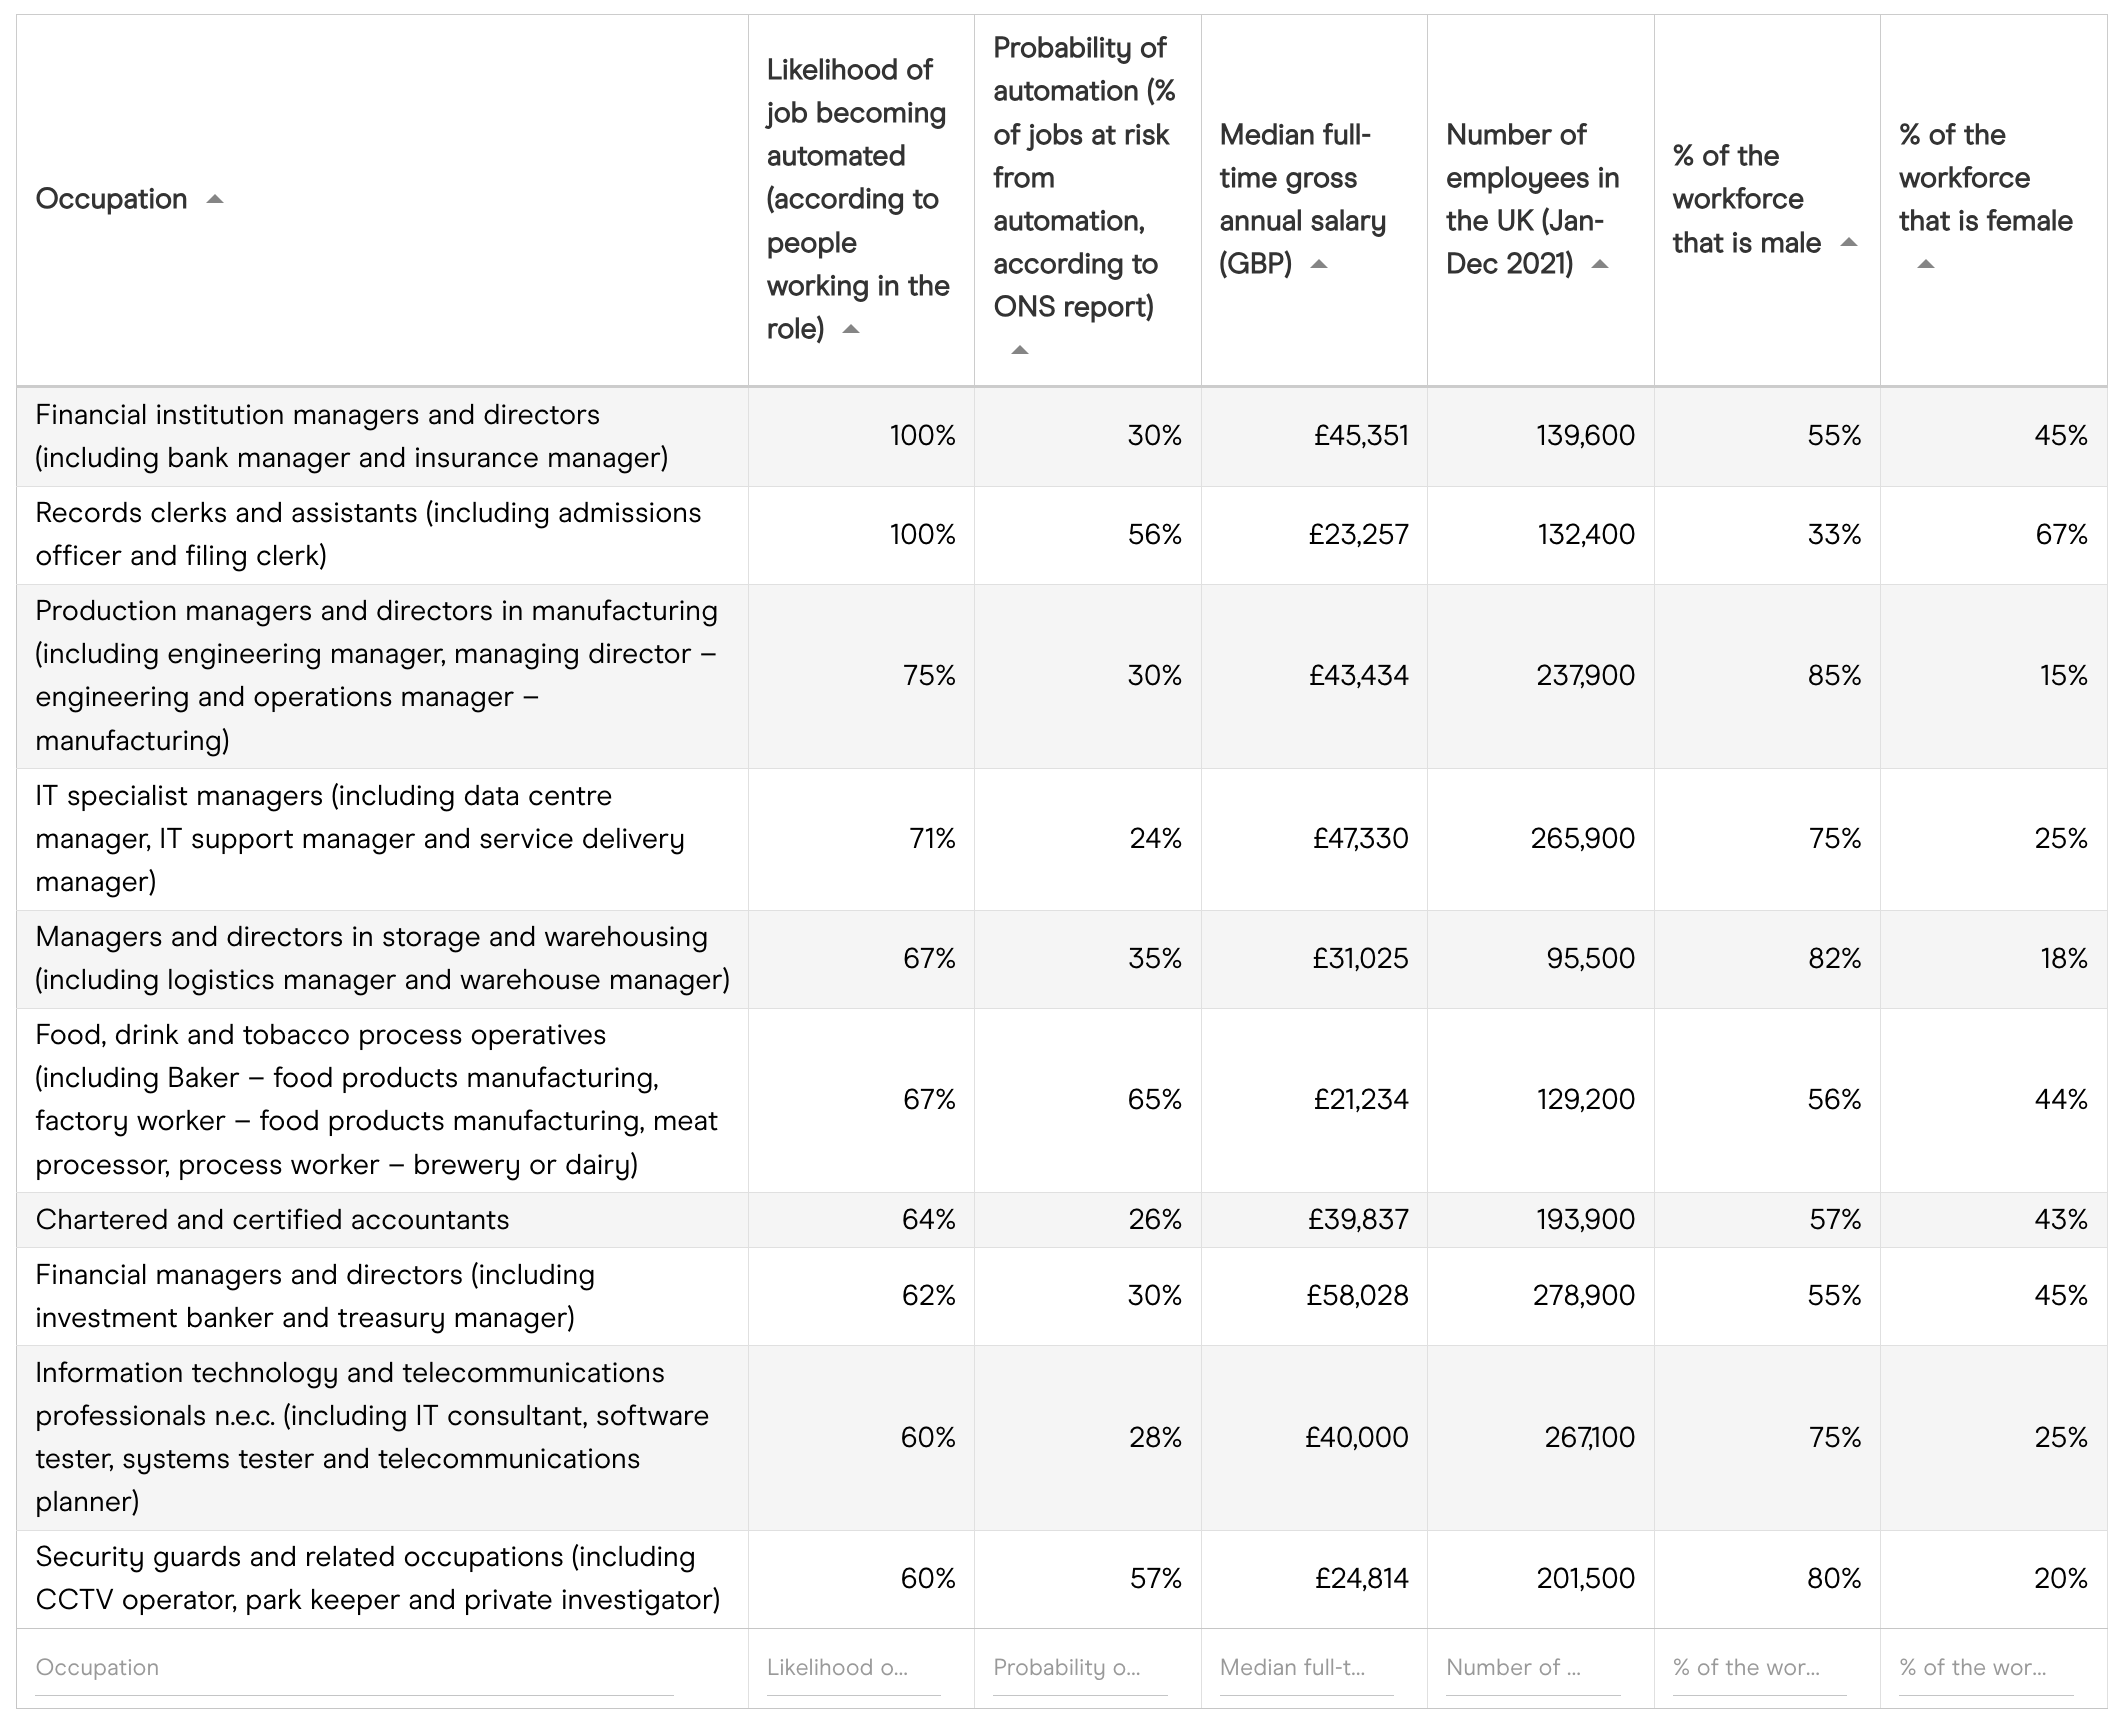
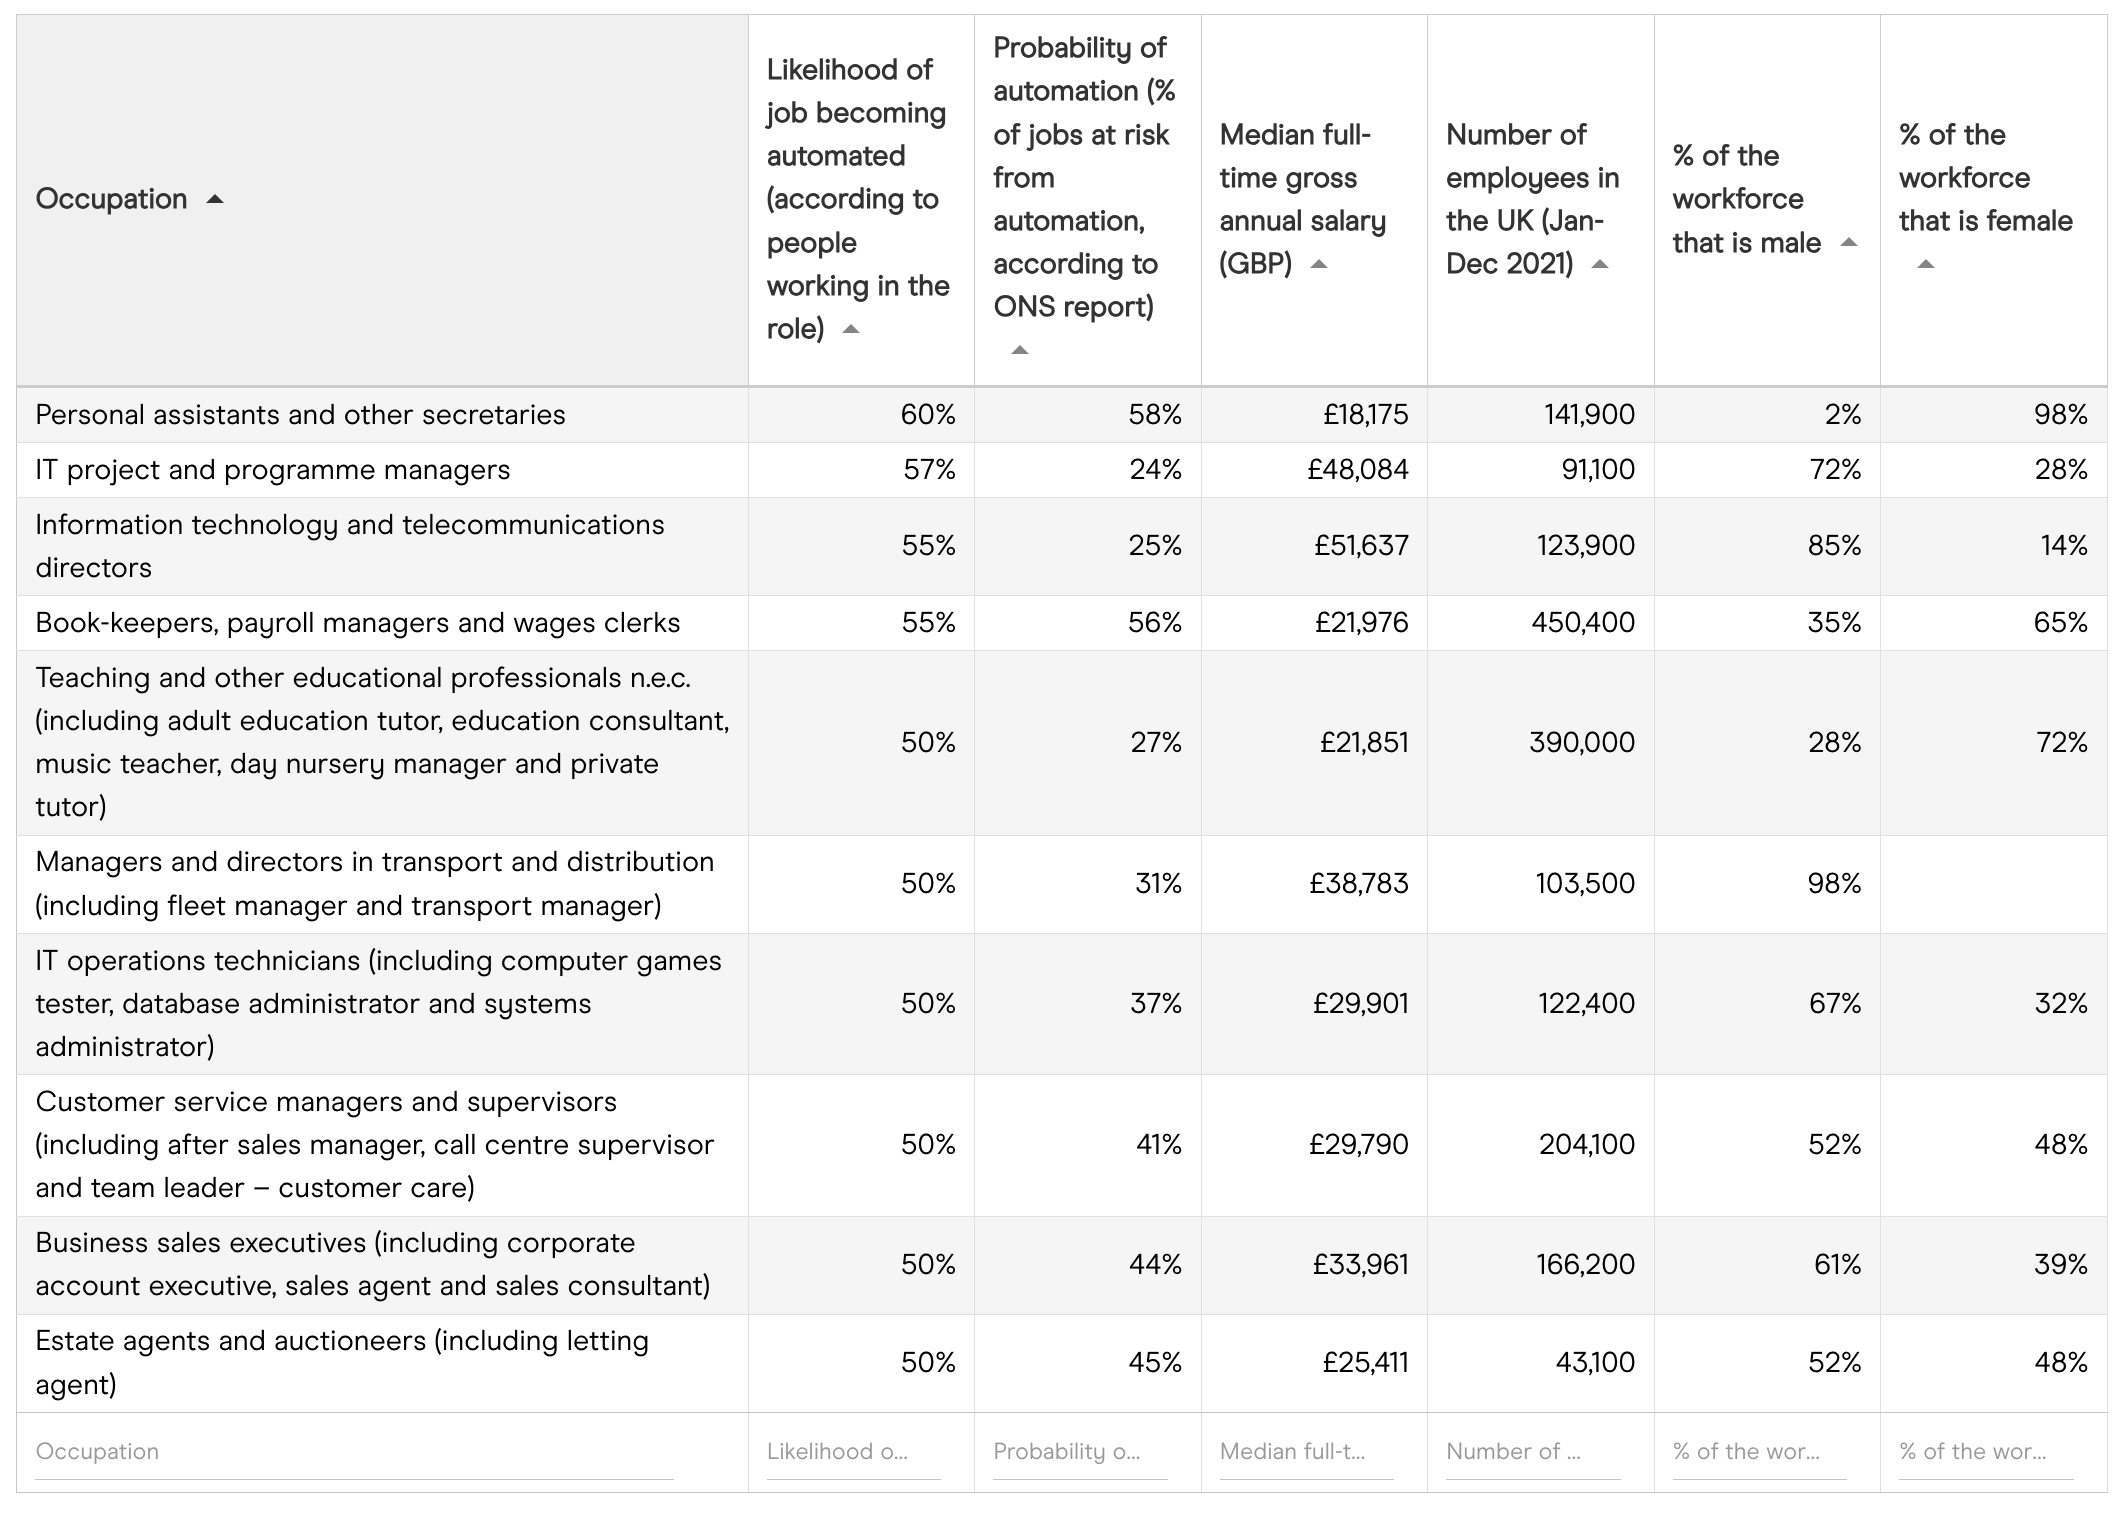
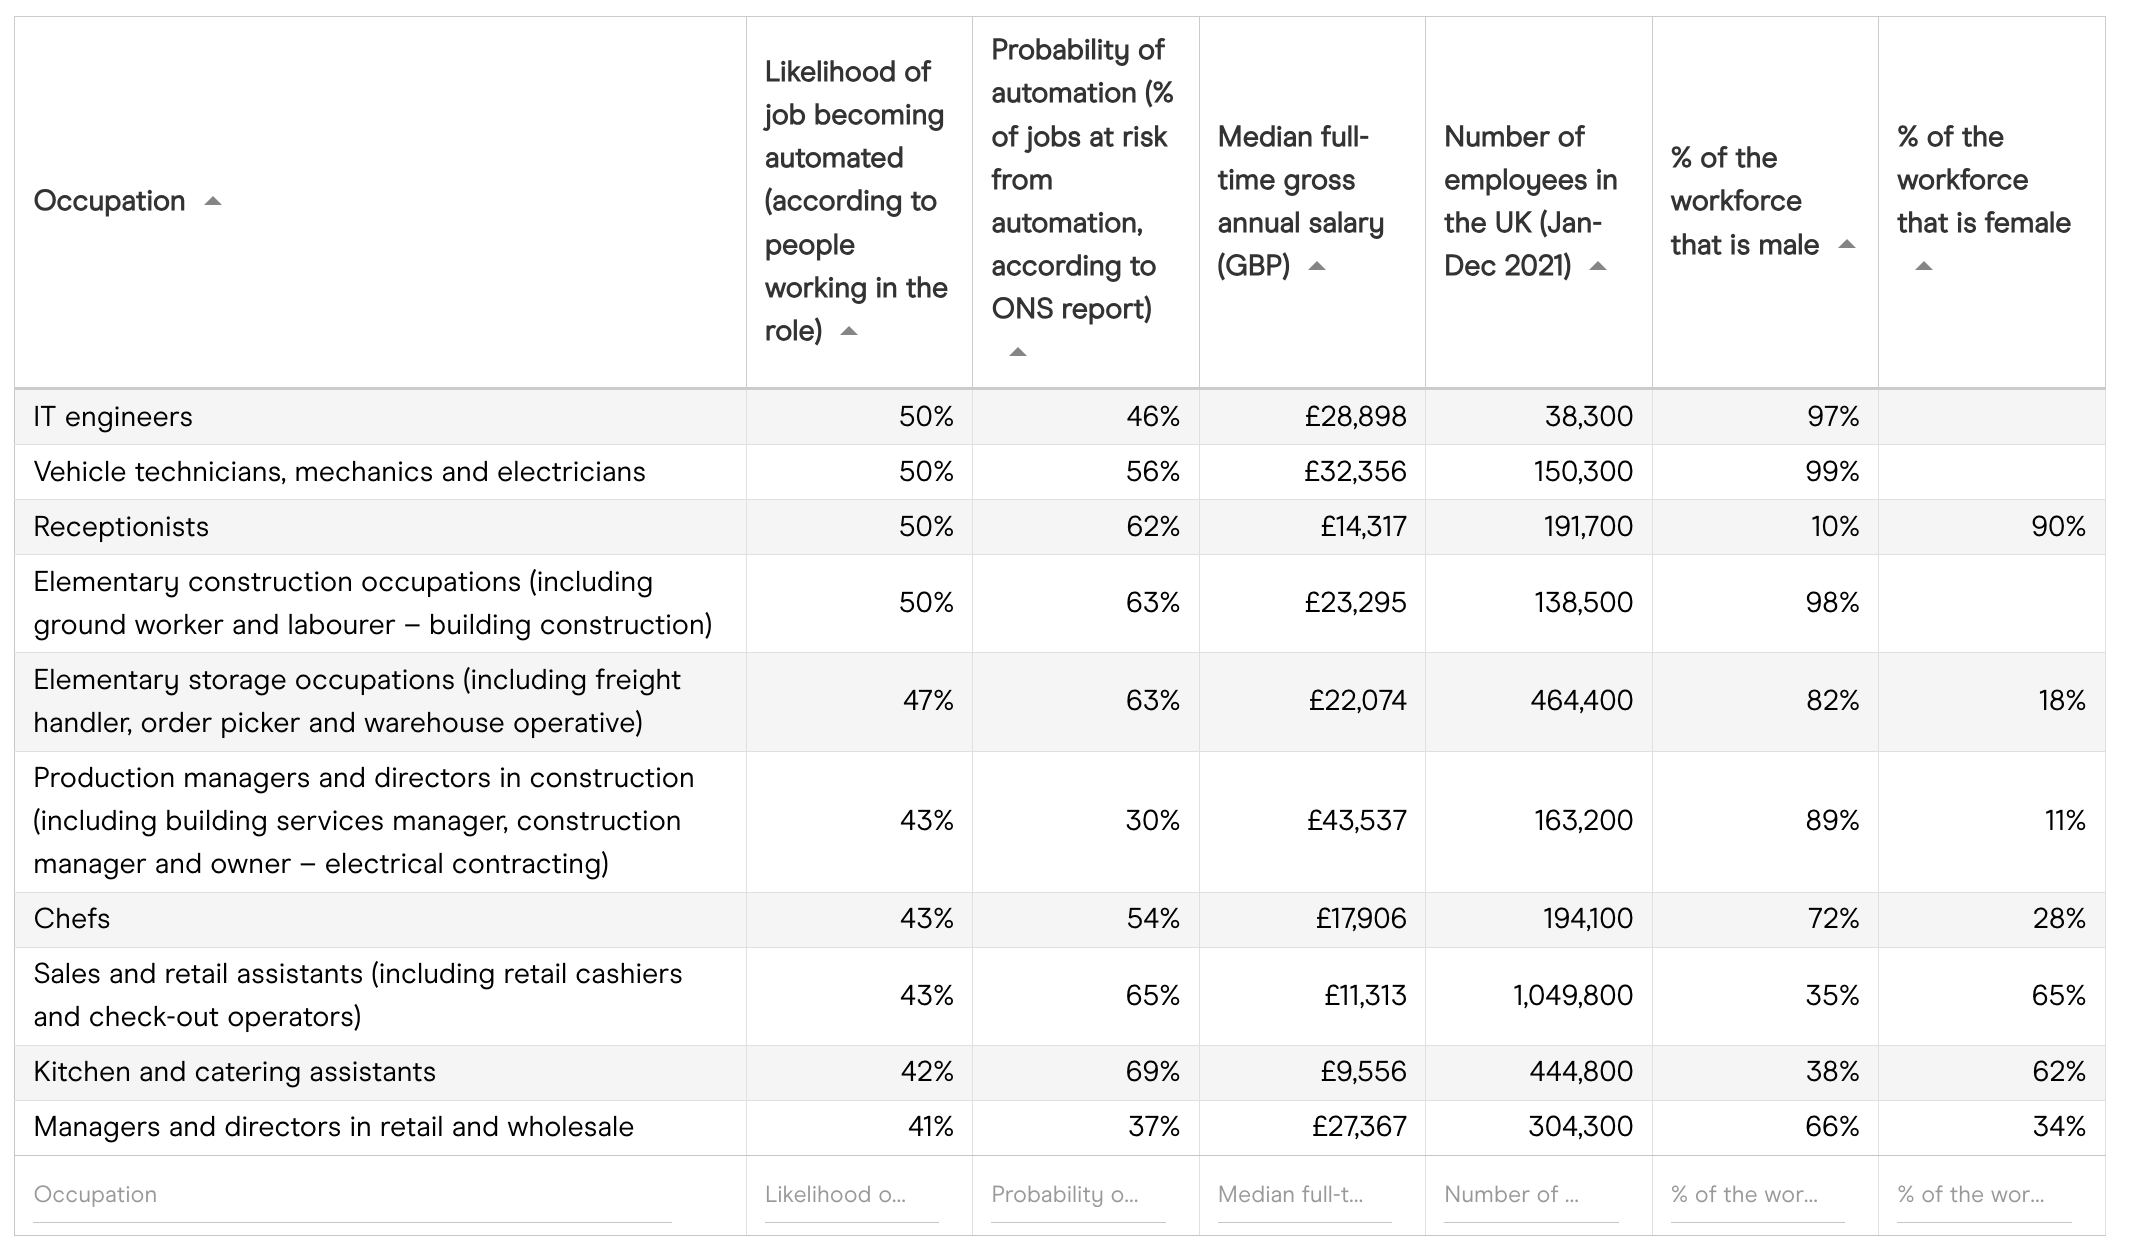
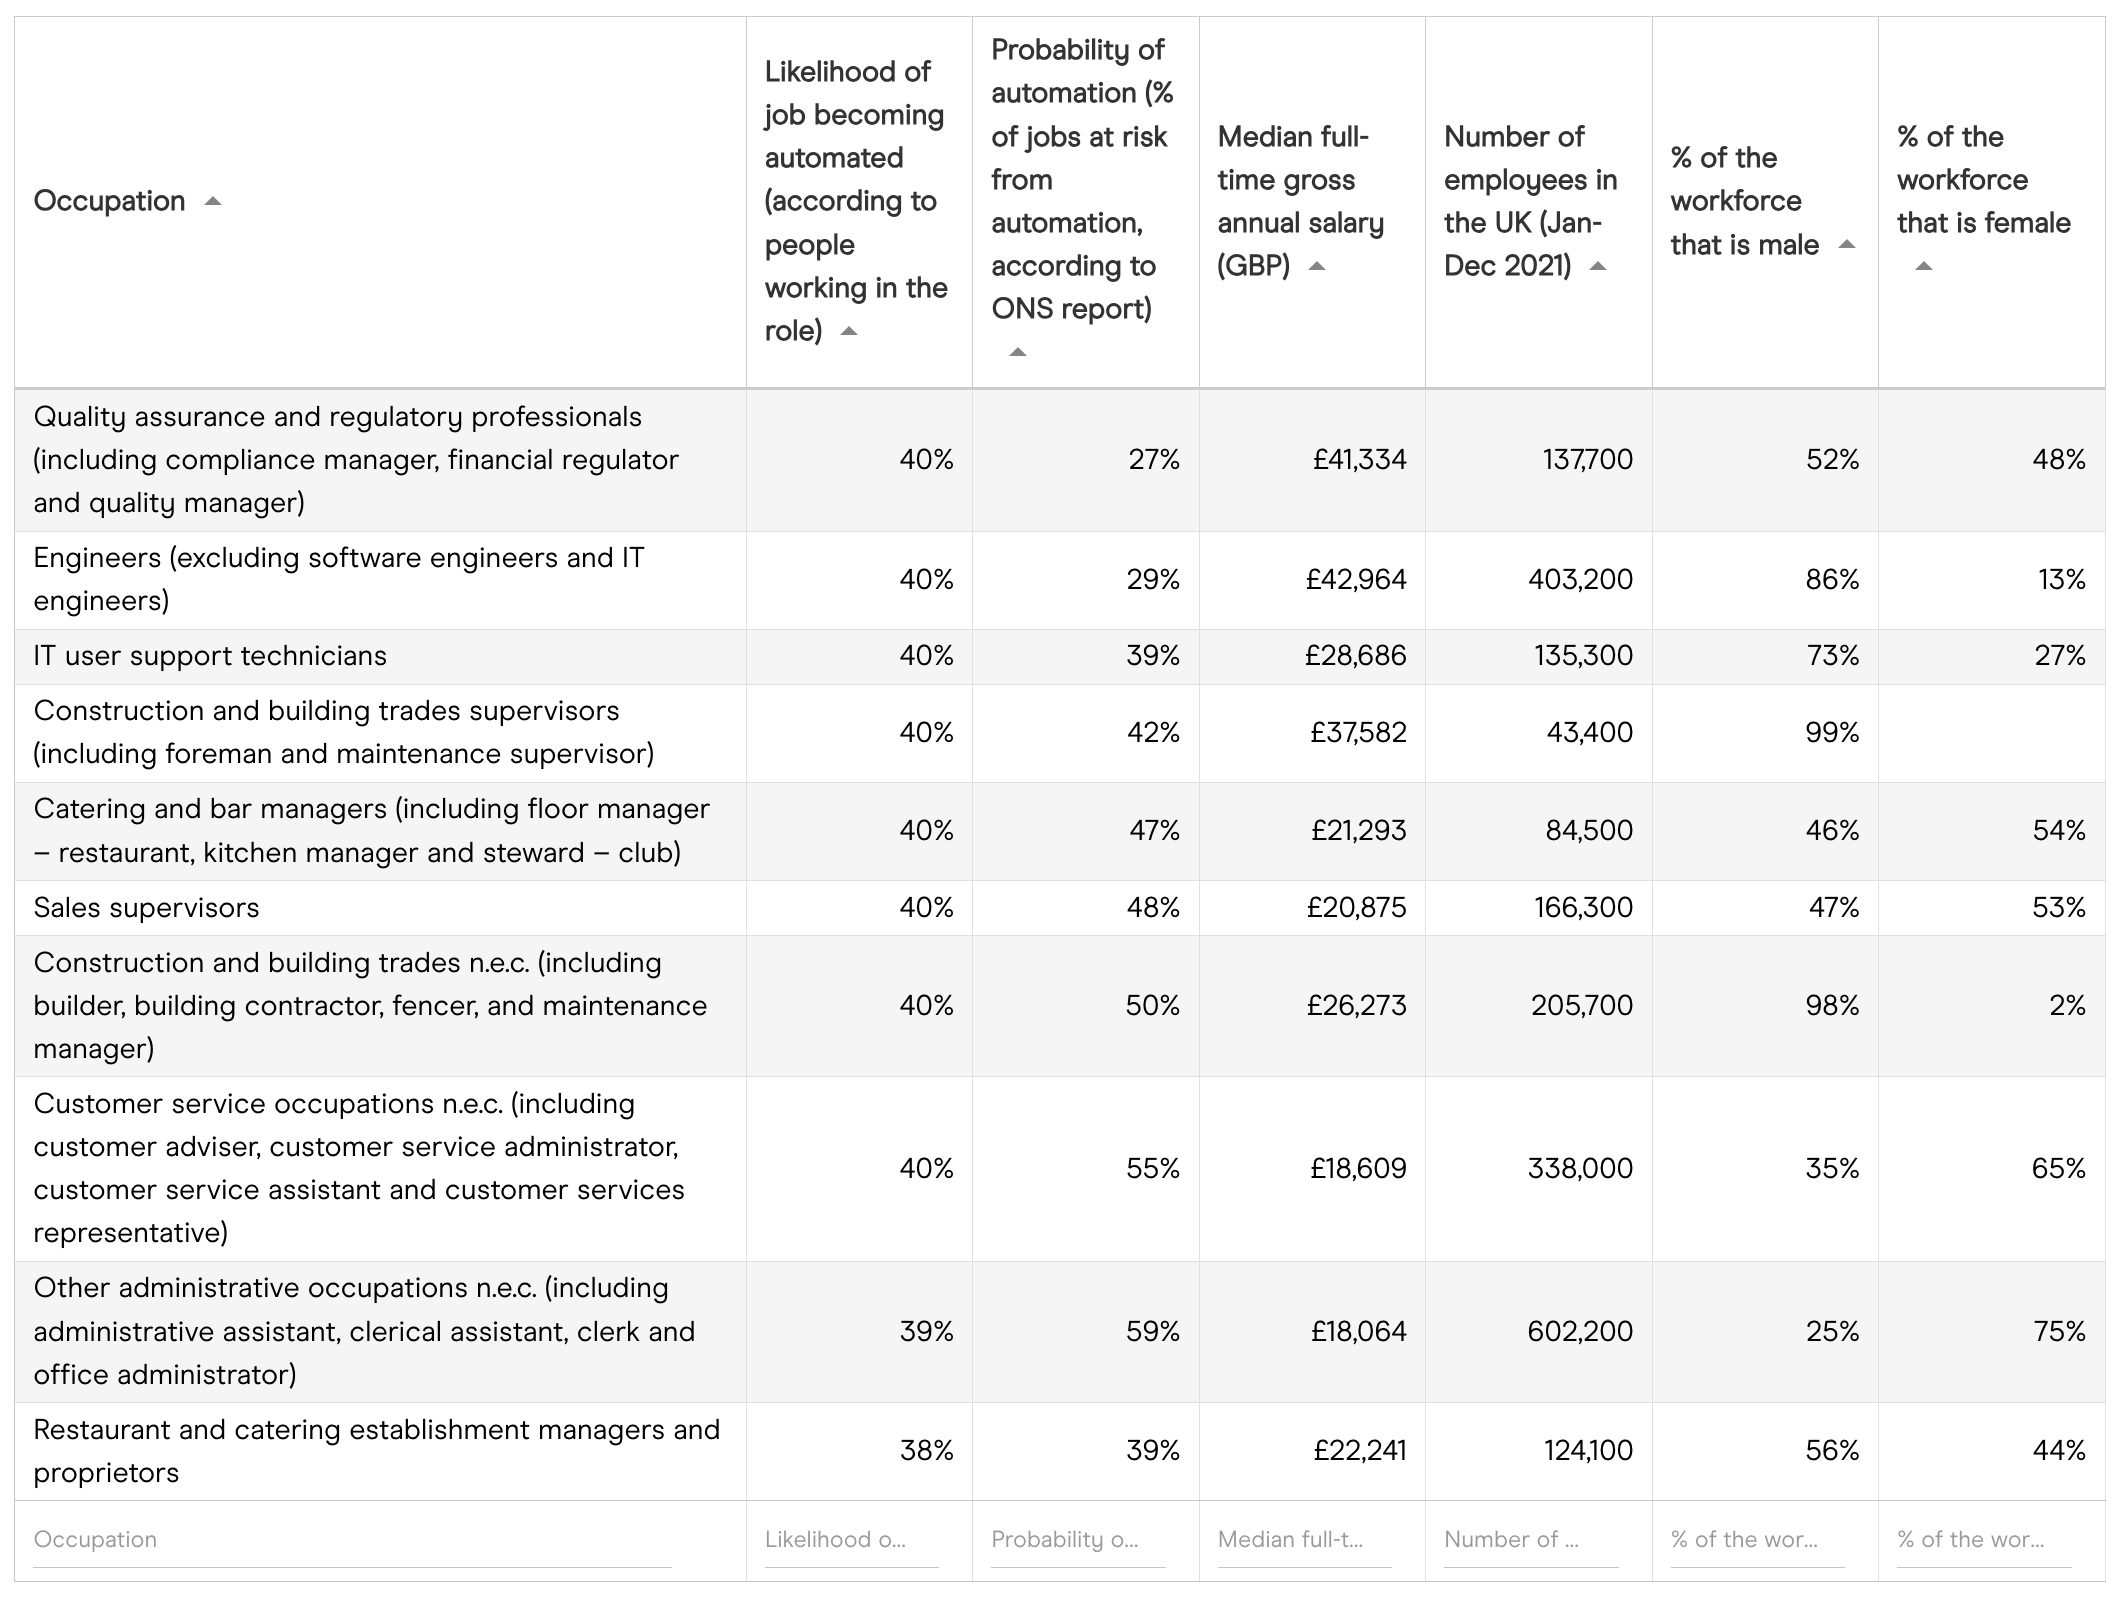
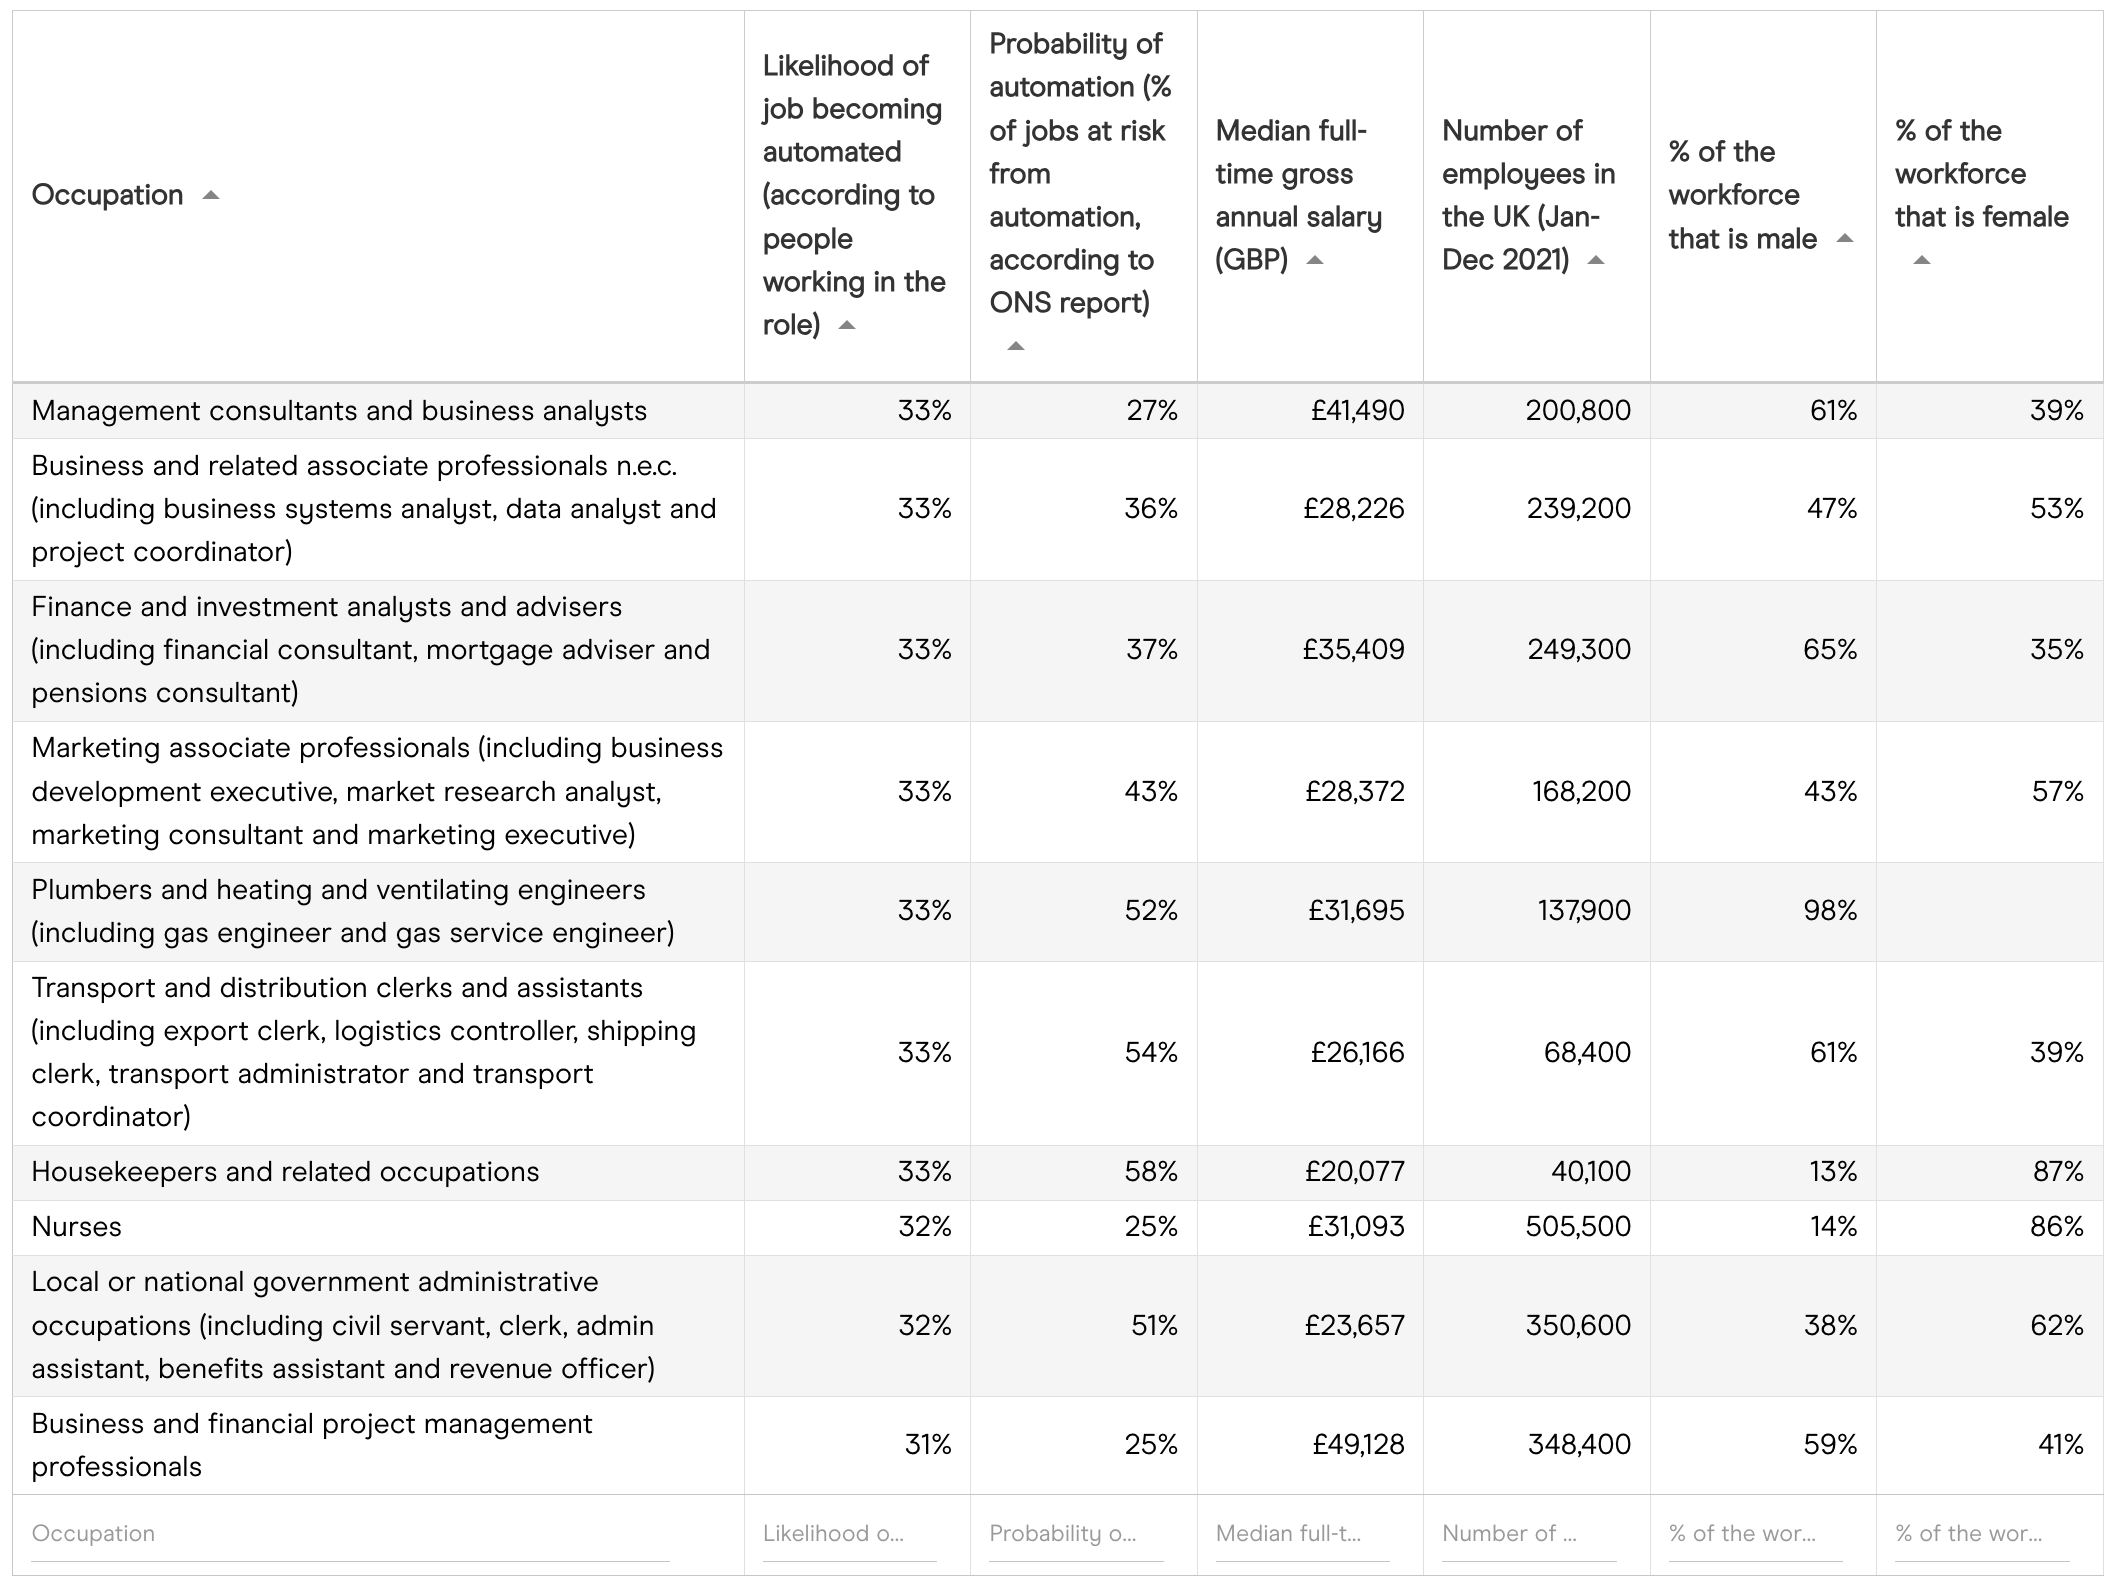
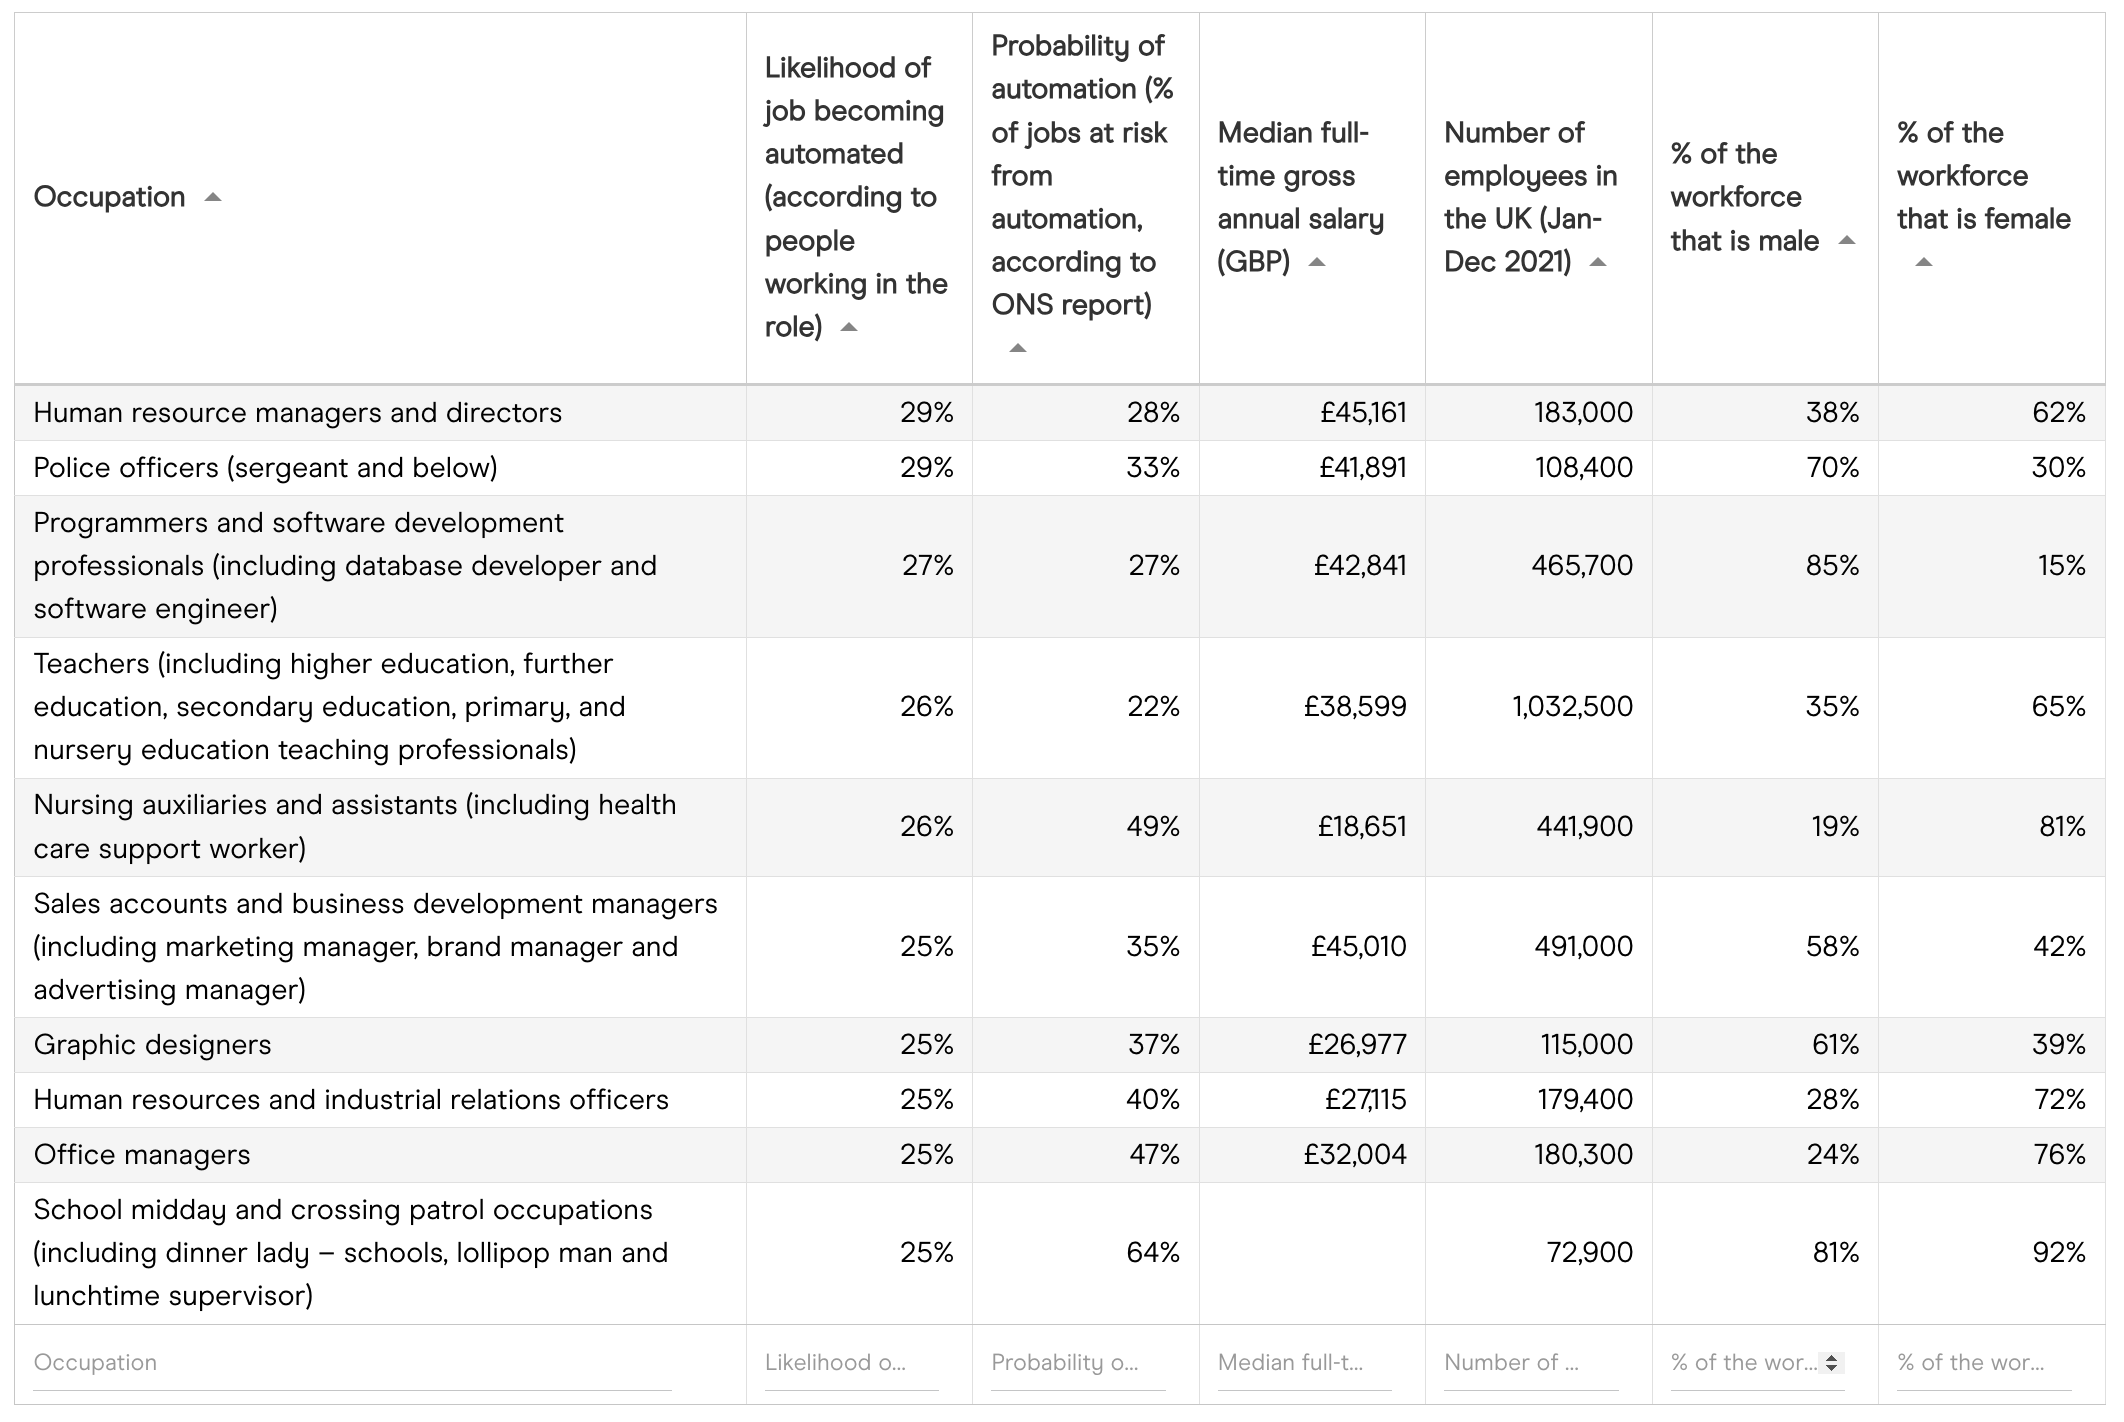
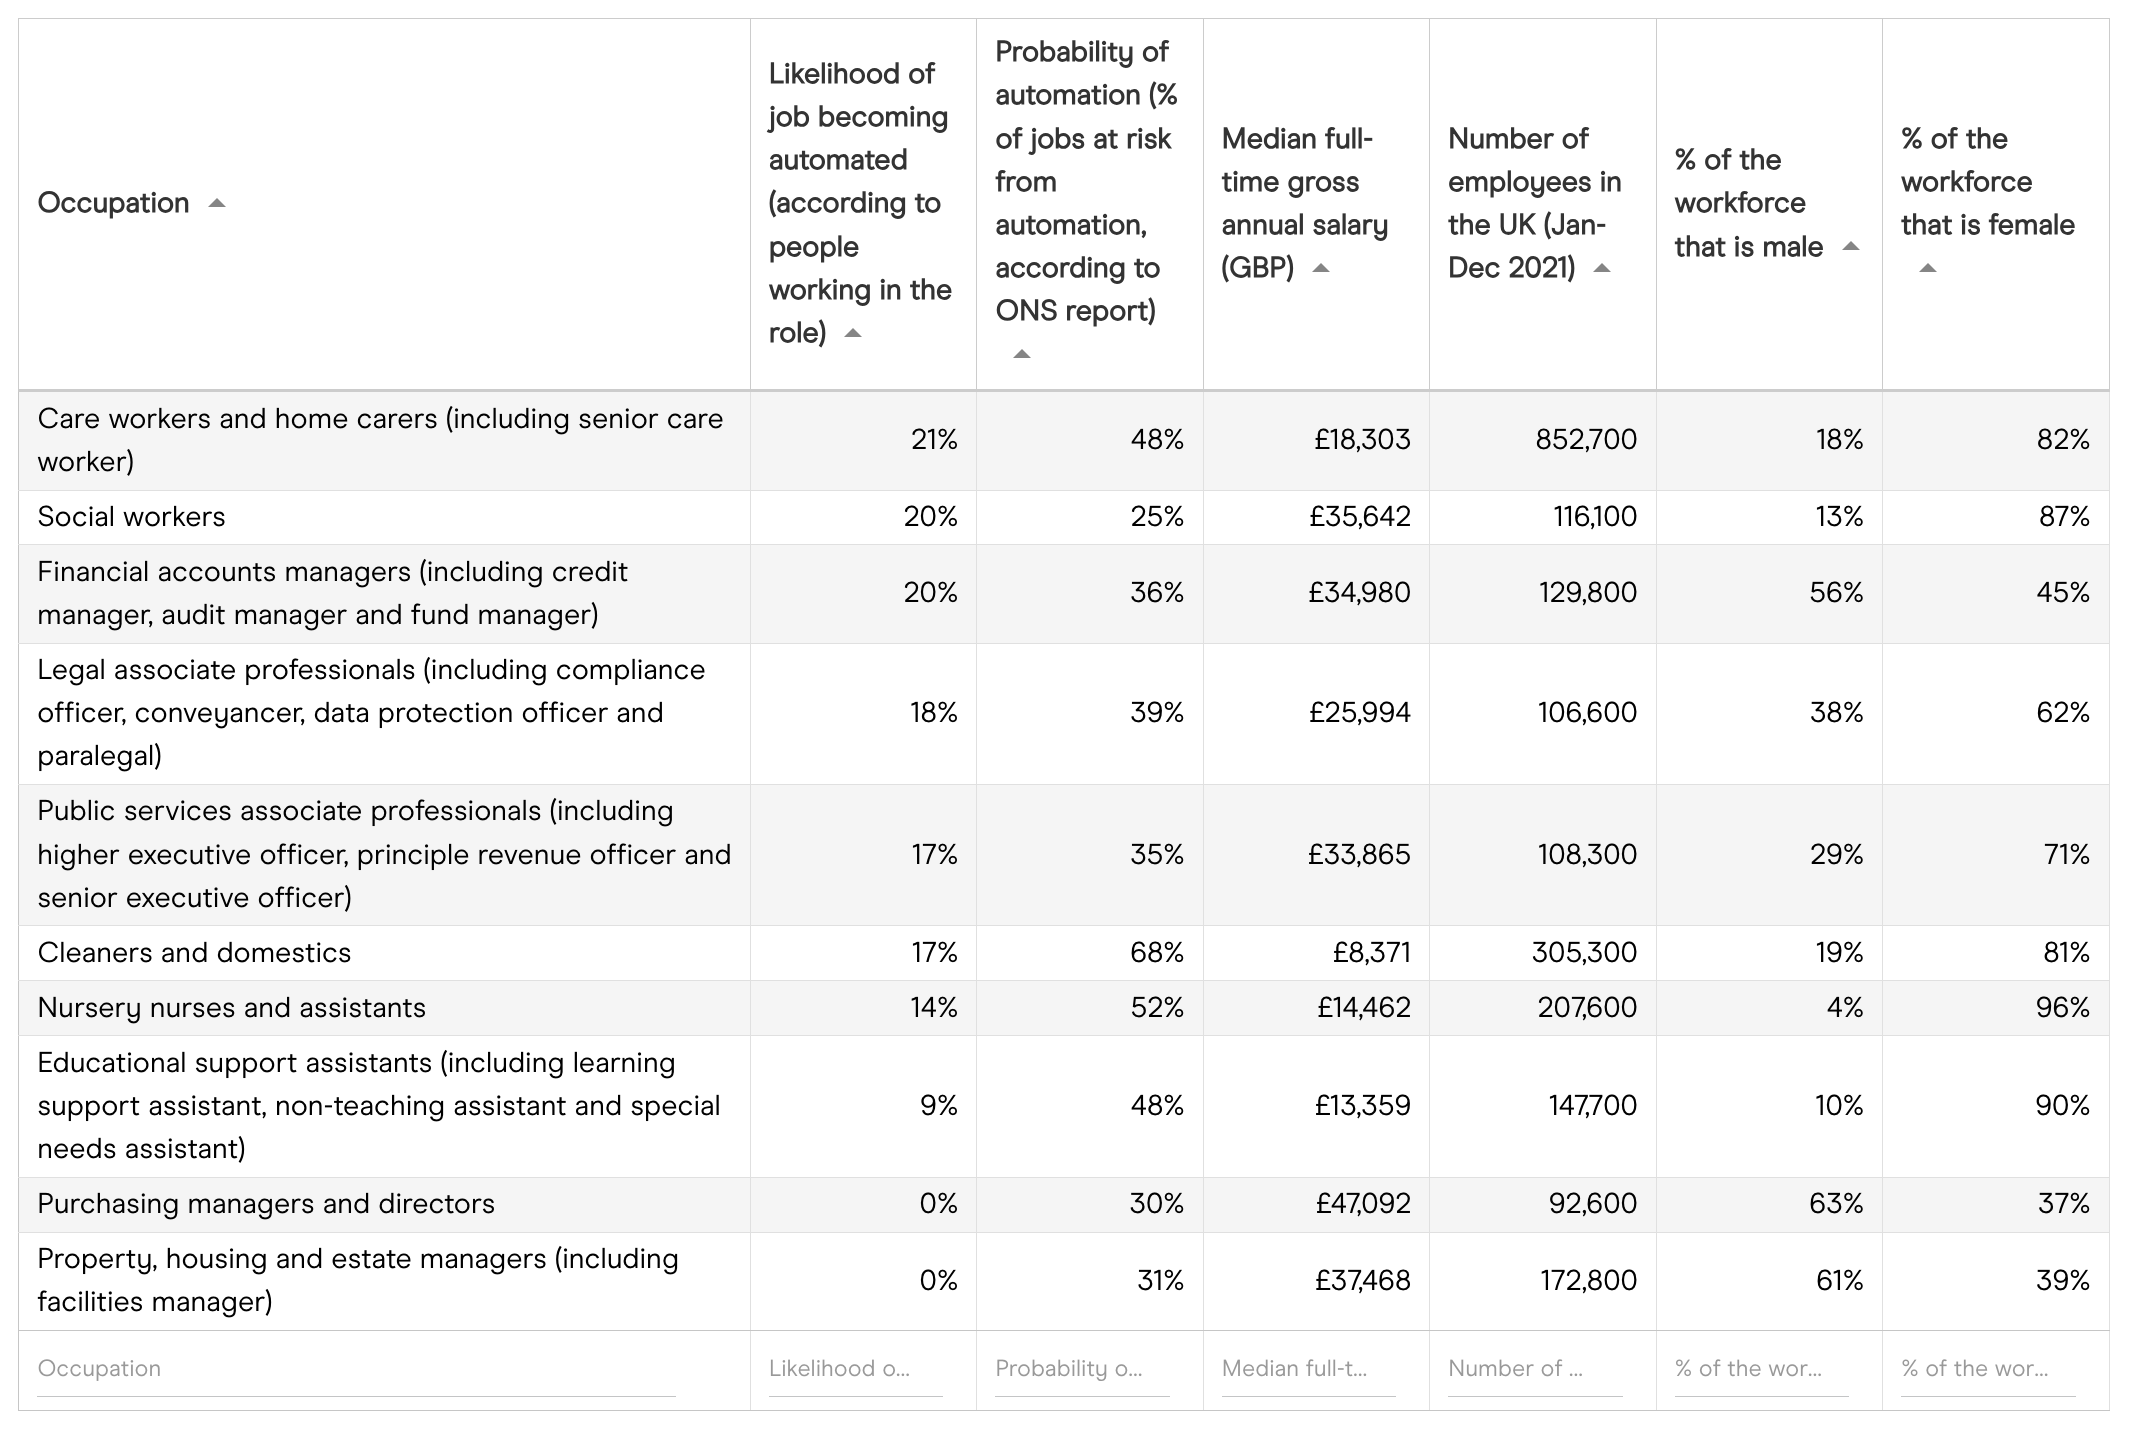
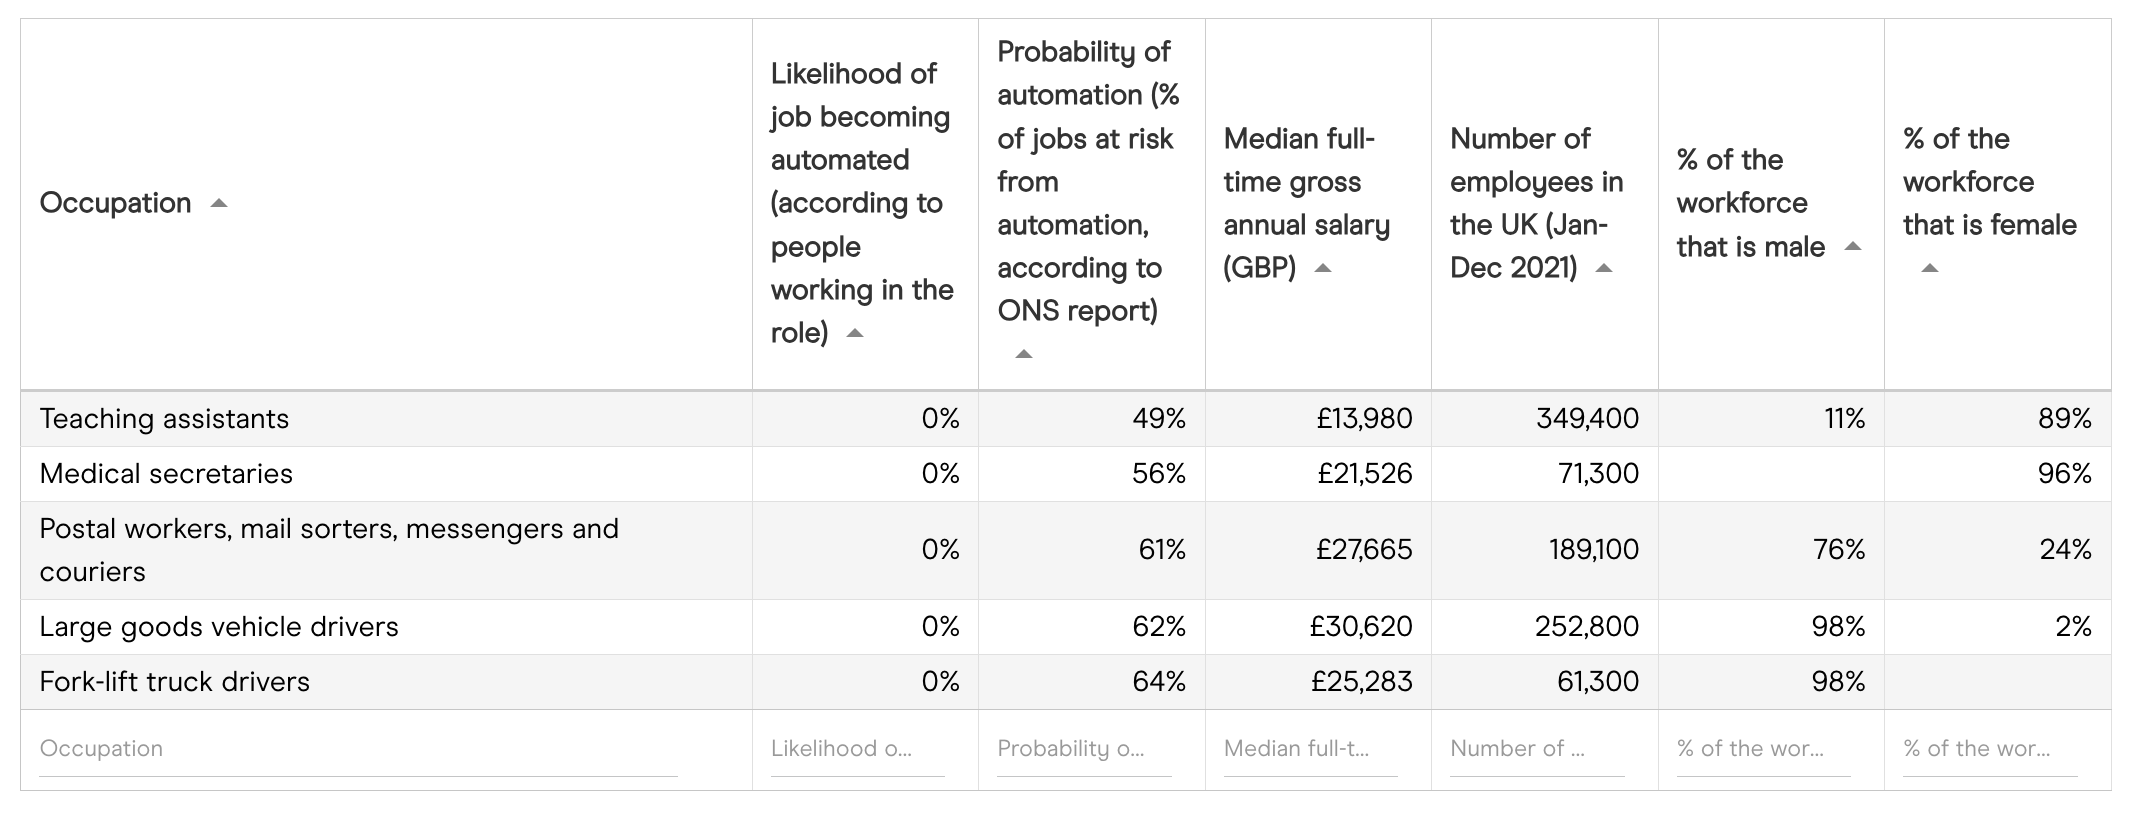
To discover more about people’s perceptions of how automation could impact their jobs, Ciphr compared its survey results with a report by the Office for National Statistics on the probability of automation in England. The findings (included below in two interactive charts) show a distinct difference, for almost all occupations included in the study, between what workers think is likely to happen to their current jobs and what ONS researchers predict will happen.
List of jobs that are considered the most and least likely to be replaced by technology or machines in the future
Notes
Ciphr polled a representative sample of 1,031 employed British adults between 25 October and 8 November 2021. People with related job titles were grouped using the Office for National Statistics’ standard occupational classifications. Due to the survey’s sample size some job titles / industries were underrepresented and therefore too statistically unreliable to include.
All external data sourced from the Office for National Statistics (ONS):
- Which occupations are at highest risk of being automated? The probability of automation in England: 2011 and 2017 (released 25 March 2019): https://www.ons.gov.uk/employmentandlabourmarket/peopleinwork/employmentandemployeetypes/articles/whichoccupationsareathighestriskofbeingautomated/2019-03-25
- NOMIS – Annual Population Survey - Employment by occupation by sex (online dataset: Oct 2020 – Sep 2021): https://www.nomisweb.co.uk/datasets/aps168/reports/employment-by-occupation?compare=K02000001
- ONS Occupation Coding Tool: https://www.ons.gov.uk/methodology/classificationsandstandards/standardoccupationalclassificationsoc/soc2020
- SOC2010 volume 2: the structure and coding index: https://www.ons.gov.uk/methodology/classificationsandstandards/standardoccupationalclassificationsoc/soc2010/soc2010volume2thestructureandcodingindex
- Annual Survey of Hours and Earnings: 2021 provisional and 2020 revised results (released on 26 October 2021): https://www.ons.gov.uk/employmentandlabourmarket/peopleinwork/earningsandworkinghours/datasets/occupation4digitsoc2010ashetable14
